


Facebook, Inc. is a well-known online social media networking service, based on Menlo Park, California, so I will just skip the overall information about the company and directly go to the main subject.
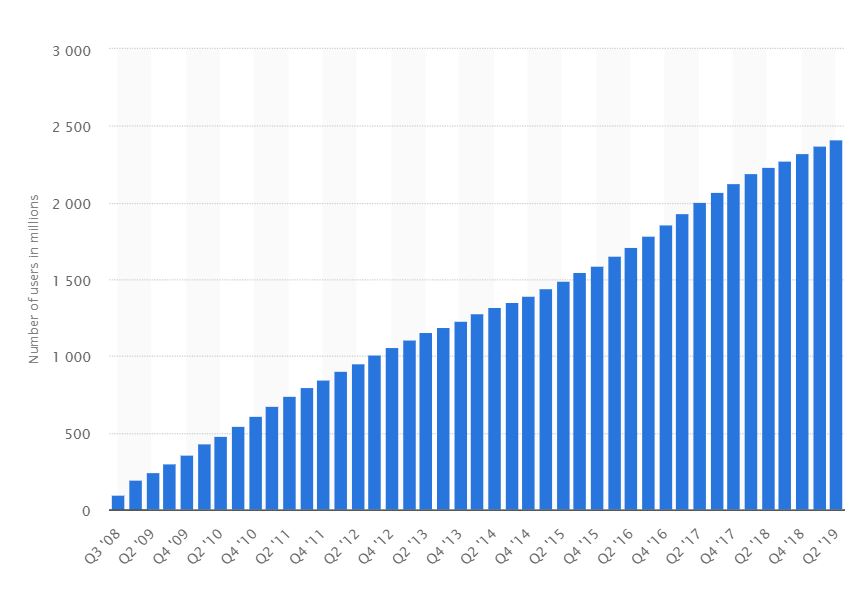
Number of monthly active Facebook users worldwide as of 2nd quarter 2019 (in millions) by “statista.com” website shows that users of this social network always kept growing, despite the negative news about selling the users information, especially after “Cambridge Analytica” testimony in the US parliament after 2016 election.
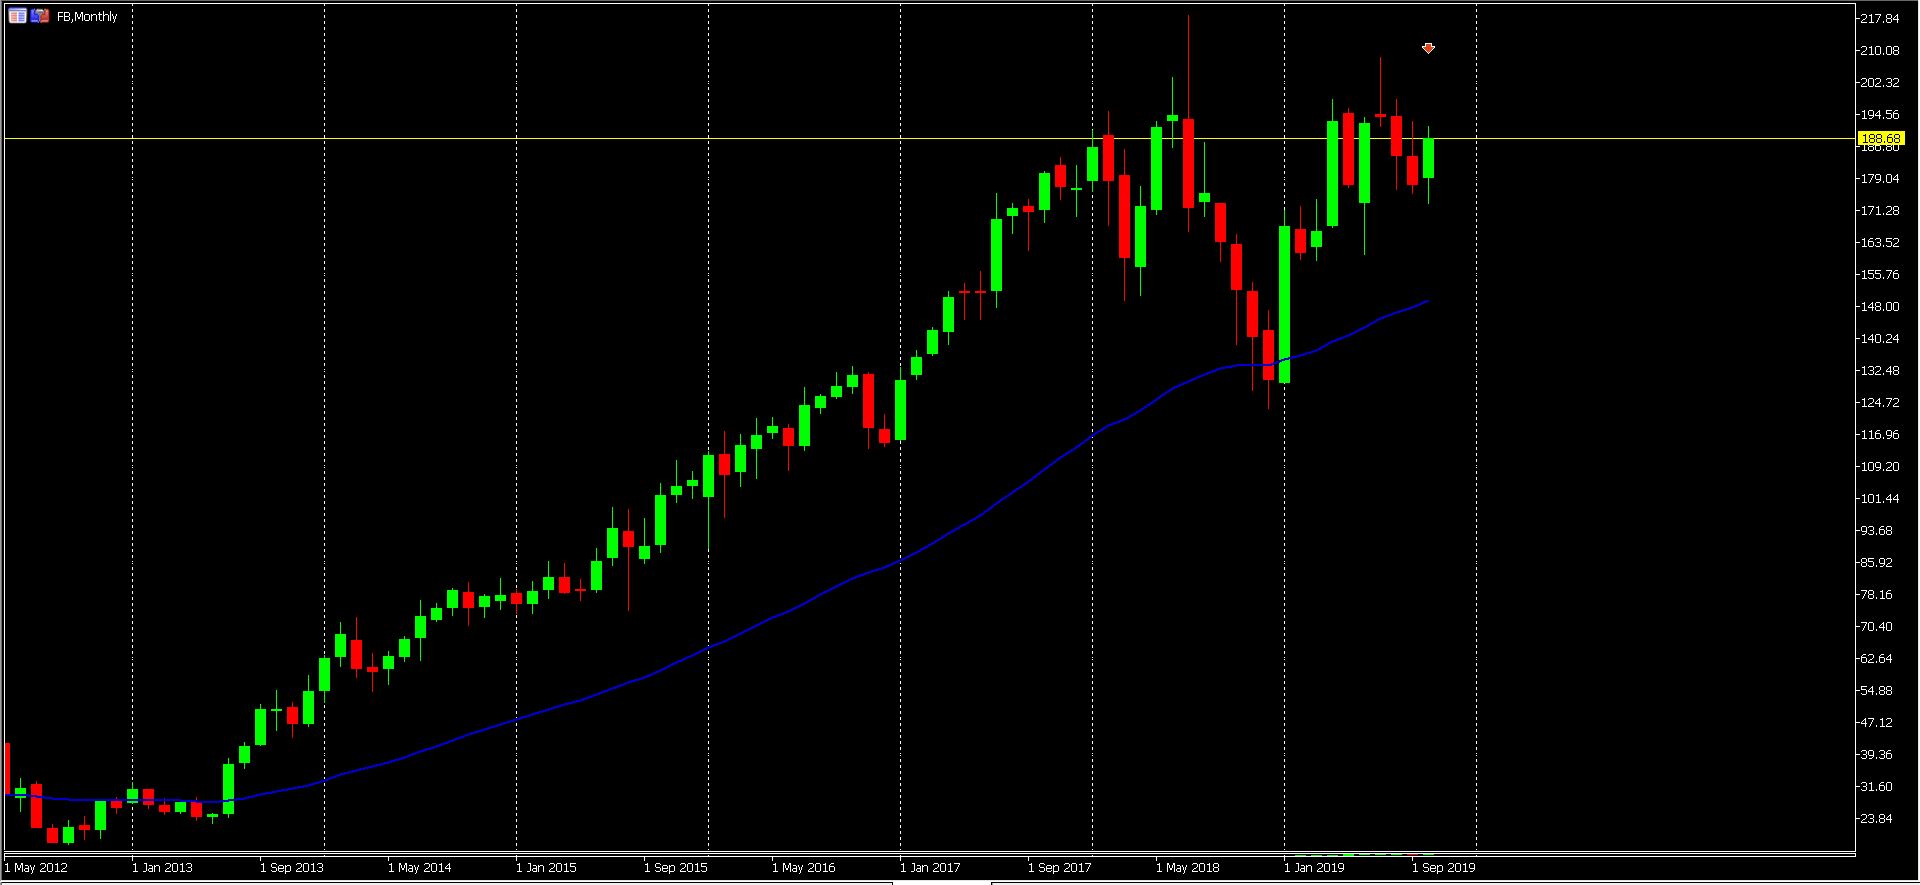
Facebook held its IPO (initial public offering) on May 18, 2012, with $38. At that time, it was the largest technology IPO in US history (Investopedia.com) however, before raising to its all-time high at $219 in July 2018, Facebook share faced the LL of $18 (September 2012) per share as well.
The company Market Cap as today (29. Oct) is around 539.122B and 123.02 – 208.66, as 52 Week Range of its share prices in the market based on “Yahoo Finance” reports. While the company missed the Q1 and Q2 market estimated in EPS, they are providing the following data about the second quarter of 2019, in “investor.fb.com”:
- Daily active users (DAUs) – DAUs were 1.59 billion on average for June 2019, an increase of 8% year-over-year.
- Monthly active users (MAUs) – MAUs were 2.41 billion as of June 30, 2019, an increase of 8% year-over-year.
- Mobile advertising revenue – Mobile advertising revenue represented approximately 94% of advertising revenue for the second quarter of 2019, up from approximately 91% of advertising revenue in the second quarter of 2018.
Q3 Estimated earnings report:
Facebook (FB) will report its third-quarter earnings report on Wednesday 30 Oct 2019, after market closes. The Zacks Consensus estimates for Q3 in different fields are:
- EPS: $1.90
- Revenue: $17.32B
Overview at the third-quarter report in past years can give us an interesting outlook. All the following data have been taken from the official FB website.
2018
- EPS: $1.74 >> Better than expectation
- Revenue: $13.038B >> Missed the expectation
2017
- EPS: $1.59 >> Better than expectation
- Revenue: $10.328B >> Better than expectation
2016
- EPS: $0.90 >> Better than expectation
- Revenue: $7.011B >> Better than expectation
The reason why I have mentioned the past three third quarters is that right after the 2016 presidential election in the US and effect of social media on that, especially when talks were about how FB is selling the customer’s data for advertisement and how it can be abuse for political matters, many believed that it can be the end of life for the social networking giant, however it survived for many reasons, which is a totally different subject and can address this subject some other time. However, since the company could pass the mentioned hard period, it is so likely from the analysis point of view, that FB earnings report can be better than the market estimated, after two quarters missing in a row. In continue, based on the “NYTimes” report at 30 January 2019, Facebook’s worst year ever was its best year ever when it came to its business. Facebook general report for 2018 showed its total revenue and profit reaching record levels.
Key data to watch:
In the third-quarter report, the key data which we need to focus on are:
EPS and Revenue, which we have talked about, however, it is also important to watch New users and active users, (DAU and MAU), we have the chart above to check. And net income, based on “macrotrends.net” data, past record to check are:
- Facebook net income for the quarter ending June 30, 2019 was $2.616B, a 48.77% decline year-over-year.
- Facebook net income for the twelve months ending June 30, 2019 was $17.063B, a 10.5% decline year-over-year.
- Facebook annual net income for 2018 was $22.111B, a 38.89% increase from 2017.
- Facebook annual net income for 2017 was $15.92B, a 56.26% increase from 2016.
- Facebook annual net income for 2016 was $10.188B, a 177.68% increase from 2015.
Technical overview:
| S1 | S2 | S3 | R1 | R2 | R3 |
| 184 | 179 | 172 | 192 | 199 | 208 |
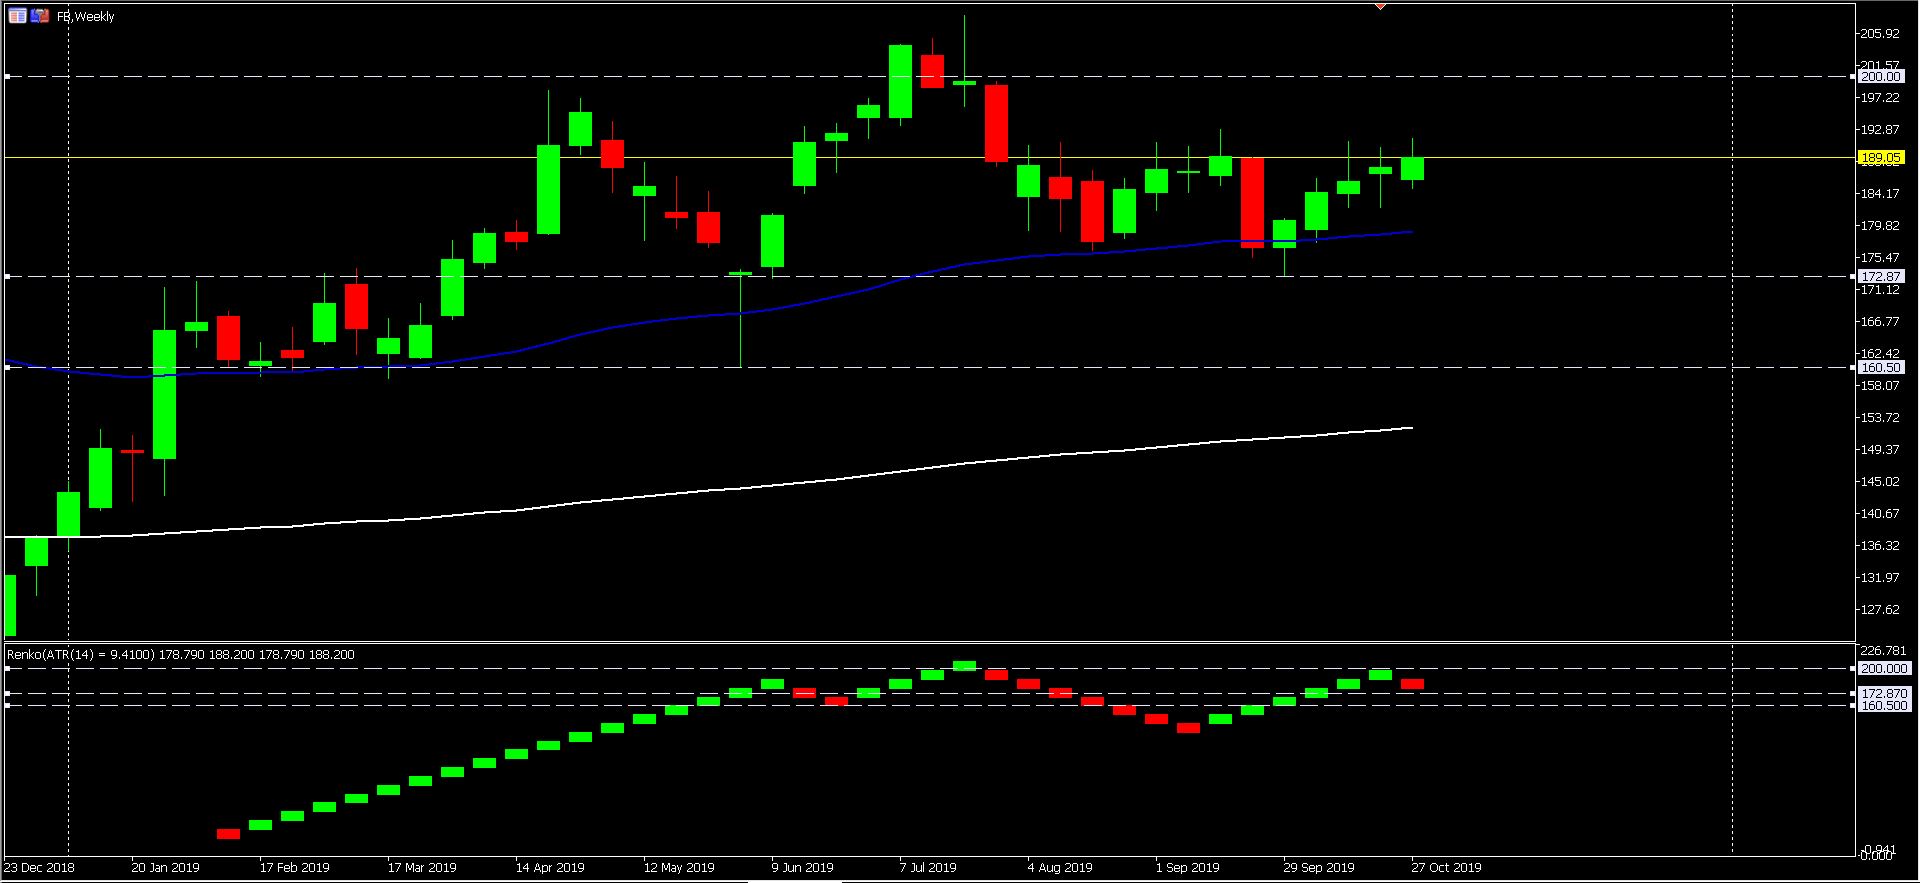
Technical indicators in all charts mostly remain of more bullish. Candles in the H1, H4, daily and weekly charts forming above the EMA 50 and 200. EMA crossing strategy also supports the bulls, while Renko chart also moves on the positive side. $172.87 and $160.50, respectively, September and Jun Low, are the key support levels, which when breaking them, can change the trend even up to $123, last December low, even if it is unlikely. On the other hand, $200 as psychological key resistance with the positive earning report is likely available which can be the green way to $208 and its all-time high, $219.
Click here to access the Economic Calendar
Ahura Chalki
Regional Market Analyst
Disclaimer: This material is provided as a general marketing communication for information purposes only and does not constitute an independent investment research. Nothing in this communication contains, or should be considered as containing, an investment advice or an investment recommendation or a solicitation for the purpose of buying or selling of any financial instrument. All information provided is gathered from reputable sources and any information containing an indication of past performance is not a guarantee or reliable indicator of future performance. Users acknowledge that any investment in Leveraged Products is characterized by a certain degree of uncertainty and that any investment of this nature involves a high level of risk for which the users are solely responsible and liable. We assume no liability for any loss arising from any investment made based on the information provided in this communication. This communication must not be reproduced or further distributed without our prior written permission.


