


US30, D1
Inspired by the Dow Theory and other movements of nature, the Elliott Wave Theory (EWT) notes two important facts regarding the stock market’s behaviour: first, the stock market movement can potentially be predicted by observing and identifying repetitive pattern of waves and, second, that these waves tend to be similar across higher and lower frequencies, i.e. patterns within a wave would also look like waves, a mathematical property related to what is known as fractal geometry. This post will elaborate as to how EWT can help us determine the direction in which a market can move, using real-time analysis.
Let us begin with the analysis then:
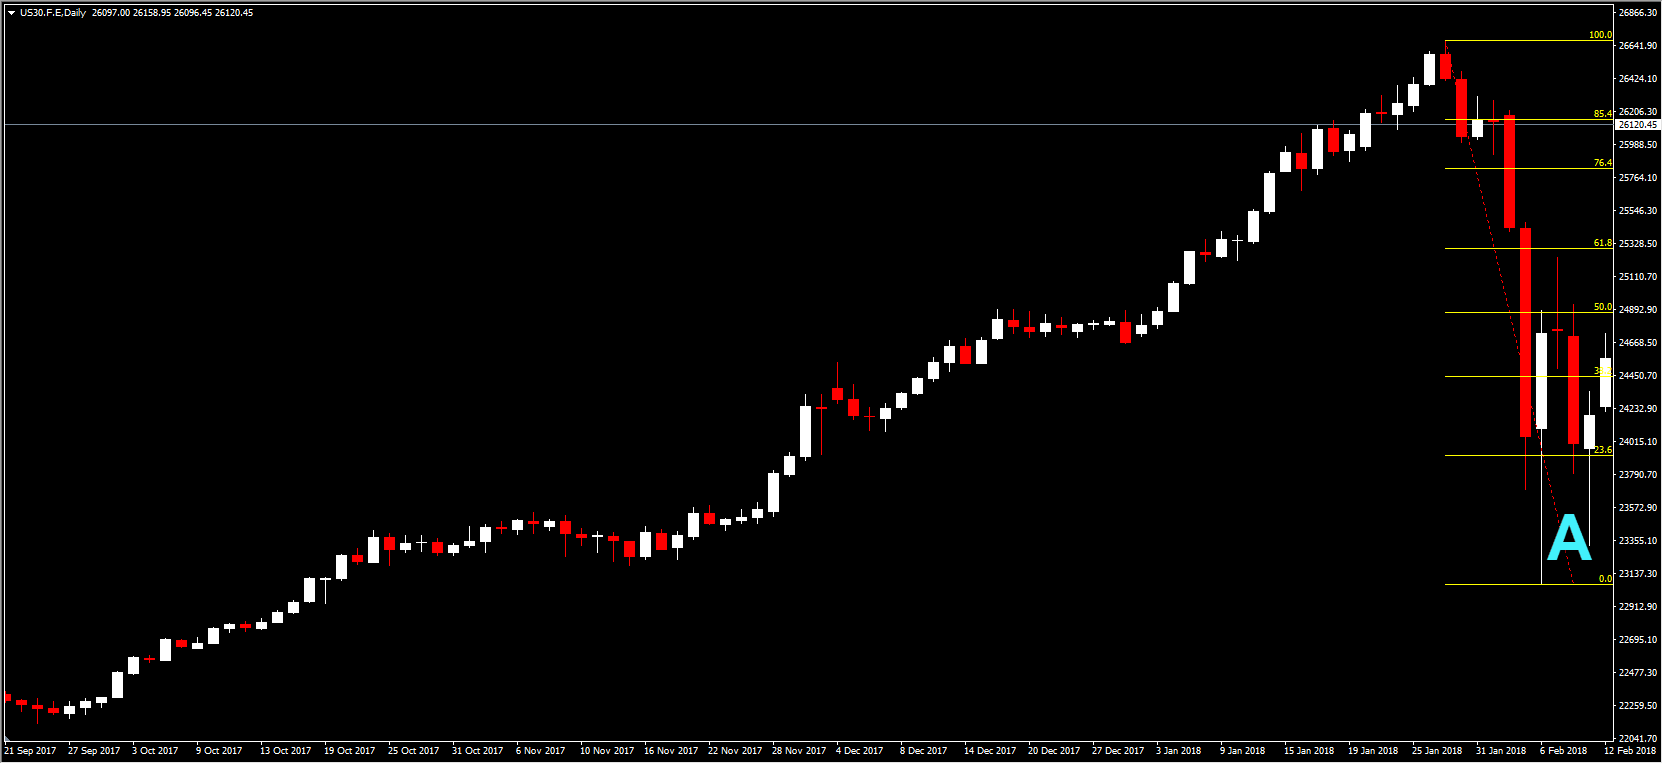
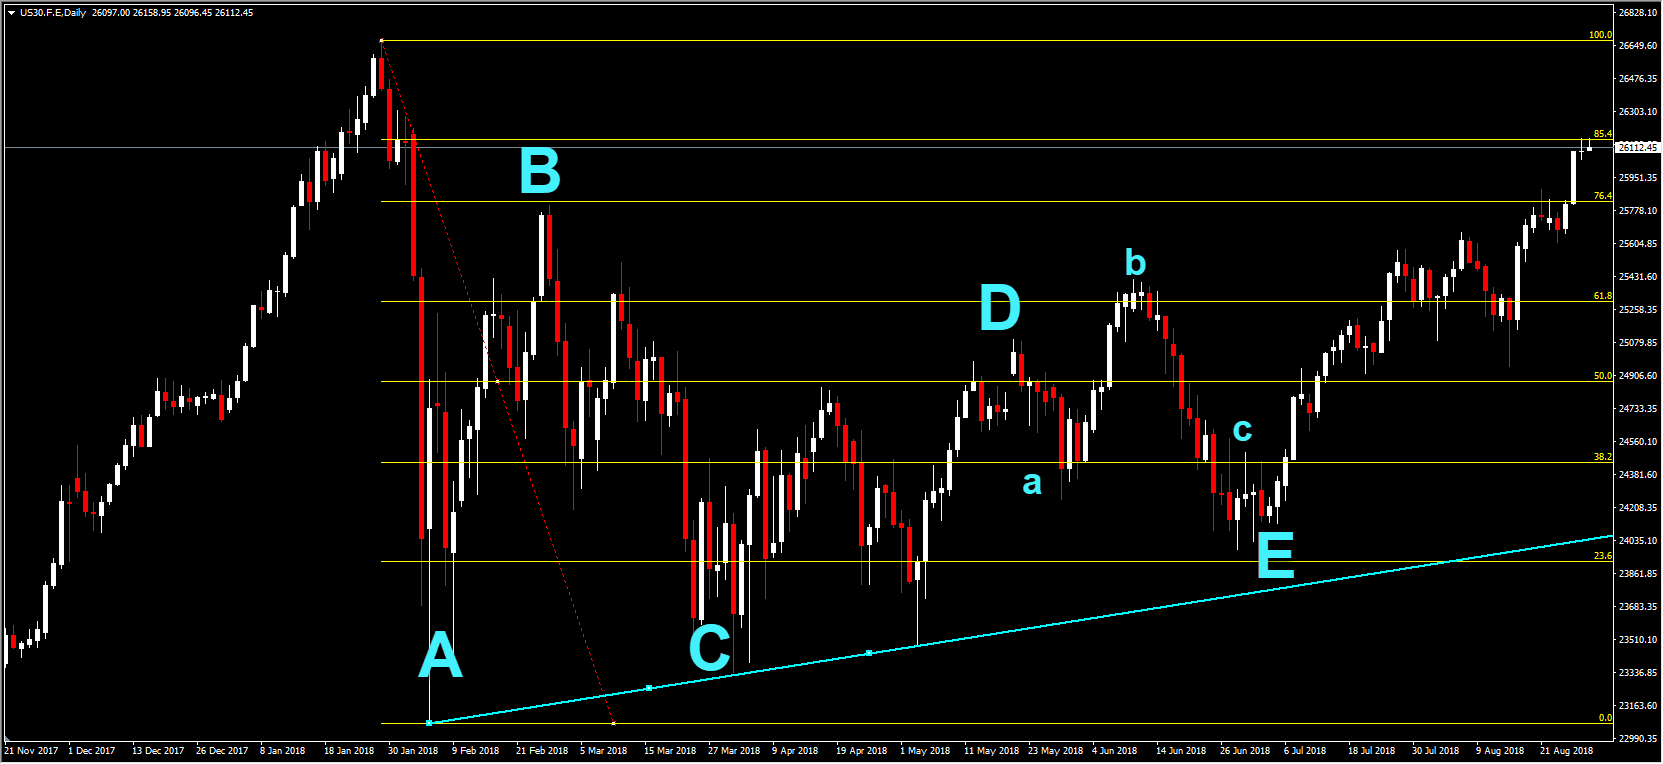
- On January 29, 2018 the US30 moved away from the previously upward trend and entered a corrective wave phase. As per the EWT, corrective waves can come in many forms, with usual flat waves expected to follow a down-up-down pattern, given that it is a downwards correction. The first wave, denoted as wave A can be seen in the figure below and was reached in February 08. The end of wave A allows us to use our Fibonacci retracement values, at the top and the bottom of the wave.
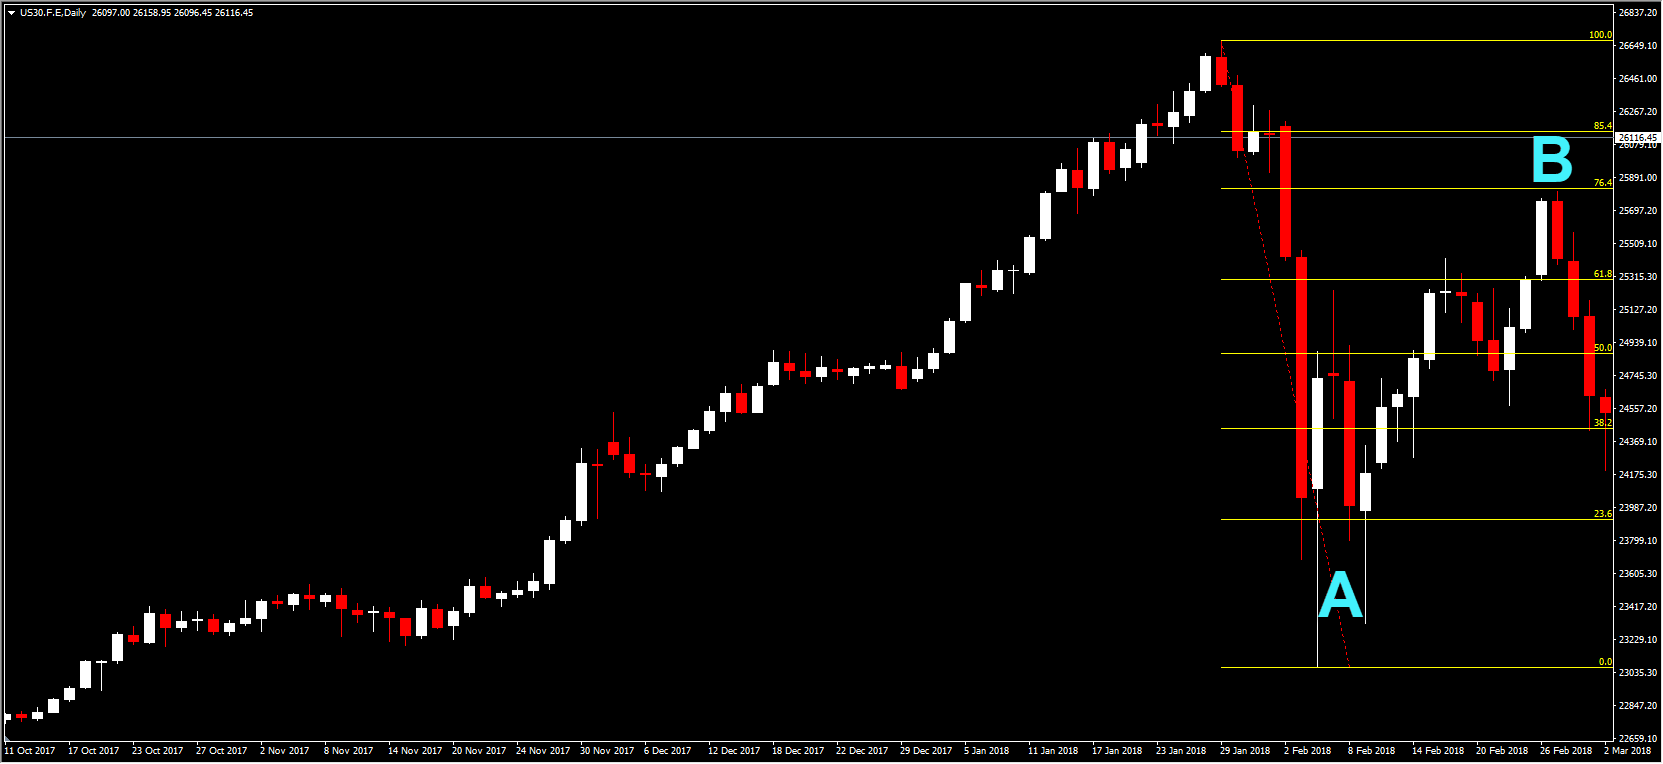
- The end of wave A was denoted by the three consecutive white candles. Since wave A was a down wave, we would expect wave B to be an up wave. Accordingly, the index followed the predicted course, reaching the top of wave B on February 26. We can consider this the top of wave B, given that three large red candles appear after the maximum. As you may notice, wave B does not cross the 76.4% Fibonacci resistance point.
- Wave C is expected to also move downwards, following the three red candles. Notice that while the end of wave C is higher than the end of wave A, this does not identify a usual zigzag or flat pattern, given that the last wave consisted only of three phases. Hence, what we are observing is most likely a triangle formation, with three phases forming a wave.
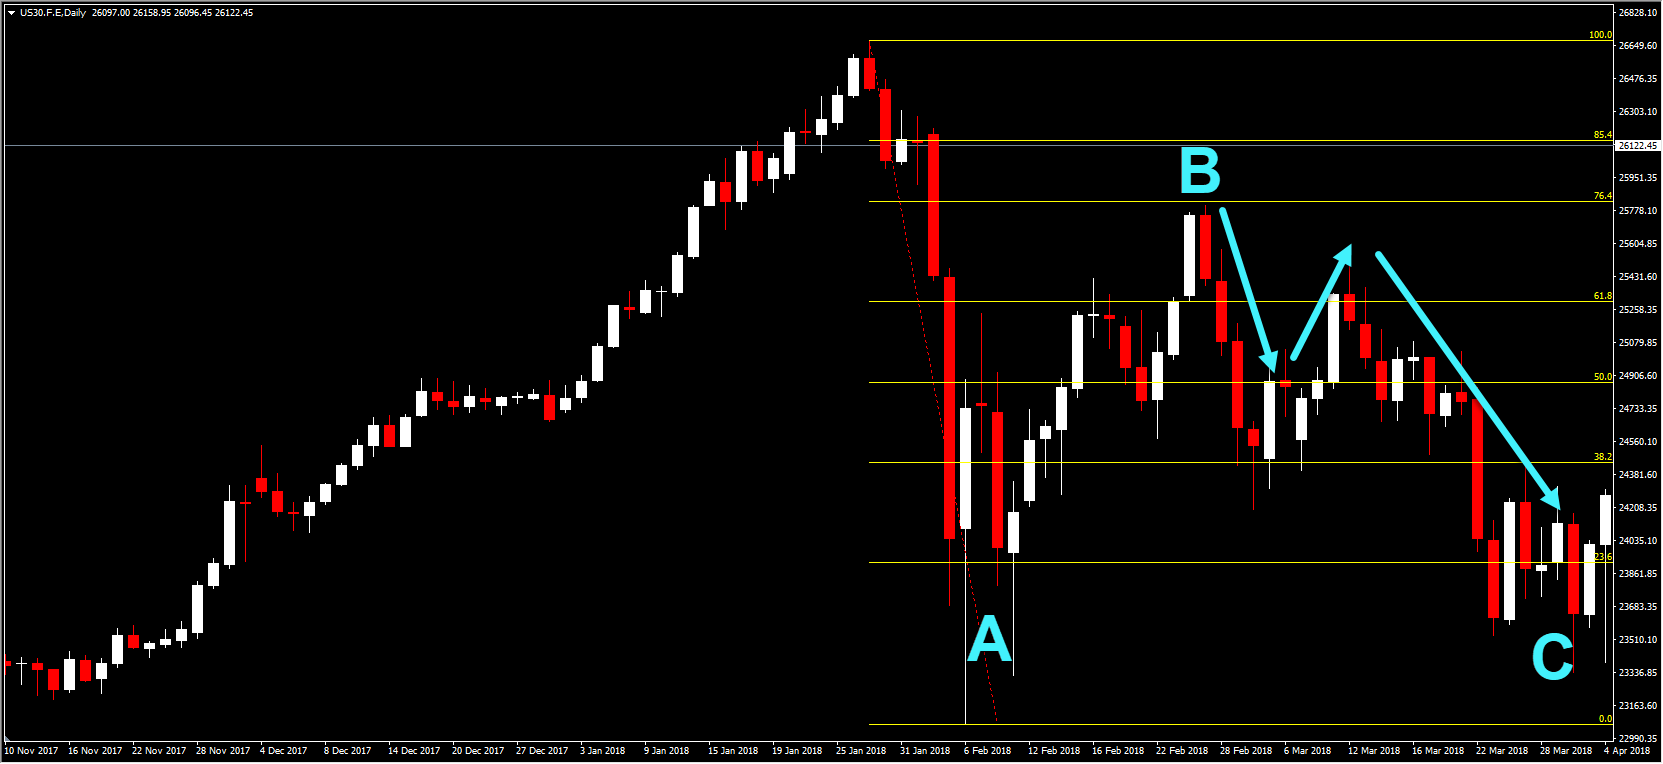
- In a triangle formation, the important part is to identify whether the triangle is ascending, descending, contracting or expanding. At this point, correct identification of the triangle path would allow us to evaluate whether the market is bullish or bearish. The line below suggests that the bottom, and hence the whole triangle is contracting. In addition, judging from the peaks of waves, the top also appears to be contracting. Following the top, the next wave is expected to be down.
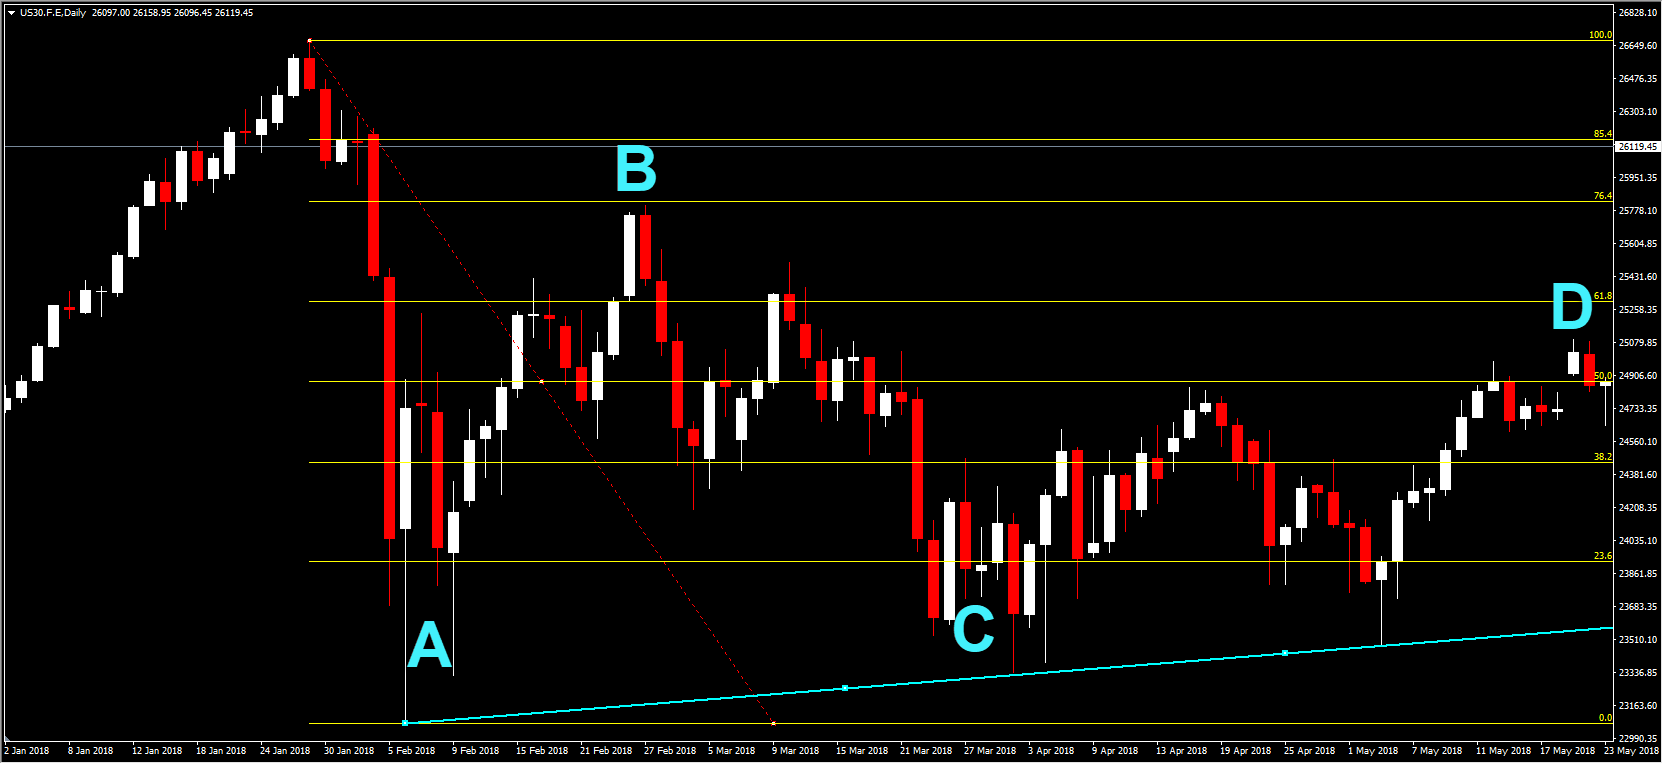
- The points in our graph suggested that we would expect wave E to be a down wave. The market moves as expected with wave E reaching its trough on July 03. Following that, the three (four in total) while large candles are suggesting that this wave has ended. A point for discussion would relate as to why the up smaller wave (in particular wave b, i.e. the up wave in the a,b,c smaller waves – remember that waves also consist of smaller waves in EWT, similar to fractal geometry) has moved beyond the top of wave D. While this should not have taken place according to EWT, notice that despite moving past point D levels, it has not moved past the 61.8% Fibonacci resistance level. As such, it would not be advised to alter our analysis on the basis of a single point. Finally, after noting where point E lies, it appears that the market is bullish and we expect a strong upwards move.
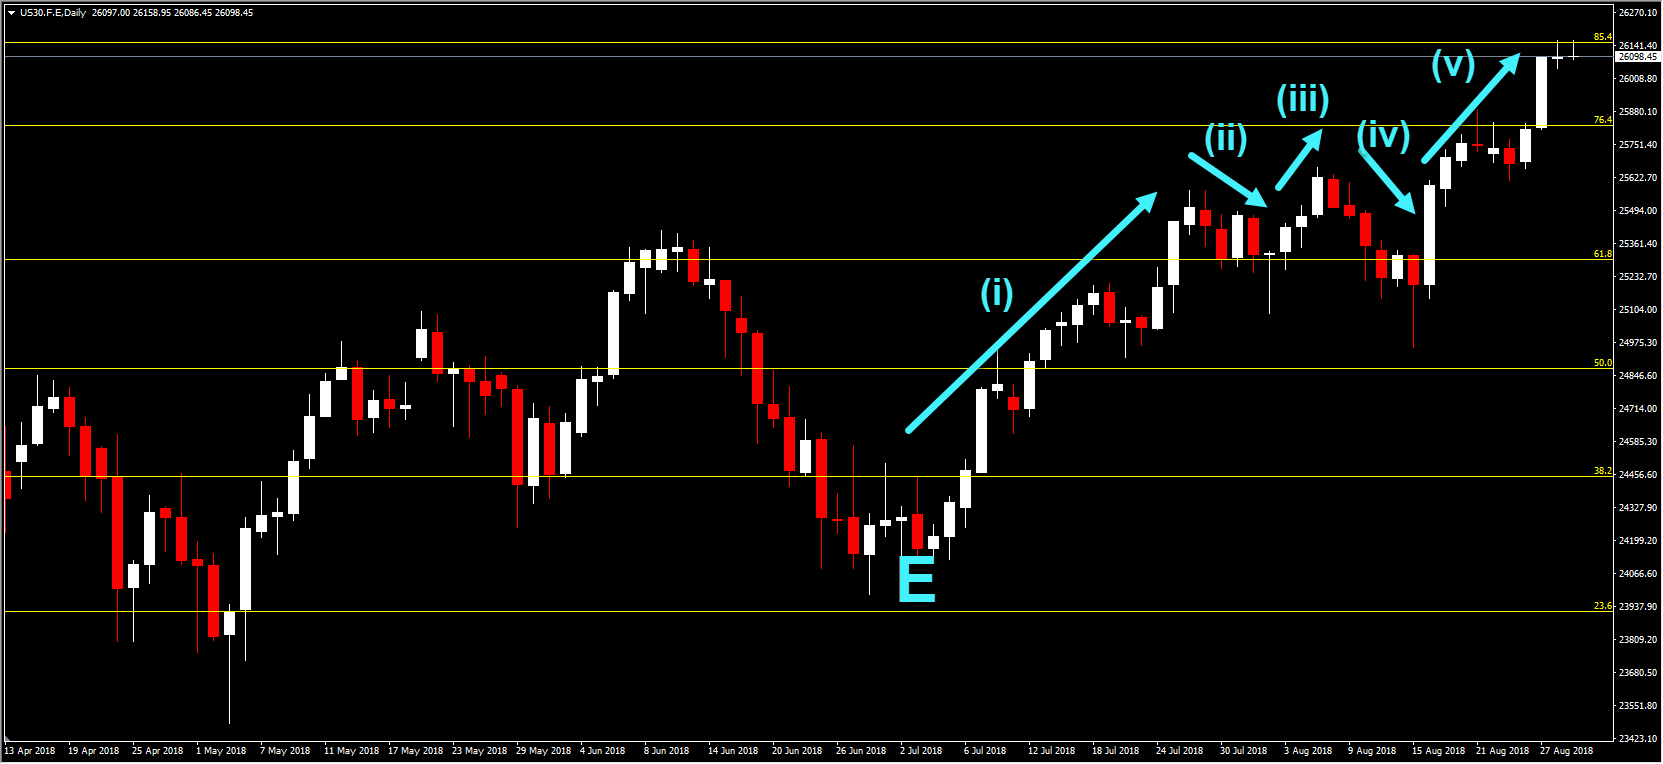
- Following the identification of corrective waves, the market has indeed been supportive of an upwards trend, breaking the 61.8% Fib. resistance level on July 25. Despite trading around the level for some days and efforts to move below it, the market moved upwards again, also breaking the 76.4% Fib level.
- What is the market outlook moving forward according to Elliott Waves then? At the moment it appears that the market is in phase (v) of the first motive way, although traders need to be careful in case the corrective wave phase is yet unfinished. Phase (v) suggests an upwards trend which has, until now not ended yet, with a resistance level at 26149 (85.4% Fib.). Traders should also keep in mind that the second wave is a down wave, and hence use proper risk management to avoid any losses.
Click here to access the HotForex Economic calendar.
Want to learn to trade and analyse the markets? Join our webinars and get analysis and trading ideas combined with better understanding on how markets work. Click HERE to register for FREE! The next webinar will start in:
[ujicountdown id=”Next Webinar” expire=”2018/08/29 15:00″ hide=”true” url=”” subscr=”” recurring=”” rectype=”second” repeats=””]
Dr Nektarios Michail
Market Analyst
HotForex
Disclaimer: This material is provided as a general marketing communication for information purposes only and does not constitute an independent investment research. Nothing in this communication contains, or should be considered as containing, an investment advice or an investment recommendation or a solicitation for the purpose of buying or selling of any financial instrument. All information provided is gathered from reputable sources and any information containing an indication of past performance is not a guarantee or reliable indicator of future performance. Users acknowledge that any investment in FX and CFDs products is characterized by a certain degree of uncertainty and that any investment of this nature involves a high level of risk for which the users are solely responsible and liable. We assume no liability for any loss arising from any investment made based on the information provided in this communication. This communication must not be reproduced or further distributed without our prior written permission.


