GBPUSD, H4 and Daily
Sterling is trading softer, losing ground against both the Dollar and Euro in the latest phase. Cable pegged a low at 1.3050, though yesterday’s low at 1.3028 has remained unchallenged so far. This comes after the release of the September BRC retail sales, which disappointed at -0.2% y/y in the same store measure, with the report highlighting that Brexit uncertainty has been crimping the hitherto robust consumer sector. This follows two surveys published yesterday (one from the BCC business lobby group and one from Deloitte) finding anxiety of businesses about the economic outlook has reached the highest level since the Brexit vote in June 2016, and the proportion of firms experiencing difficulties in hiring staff to be at a record high.
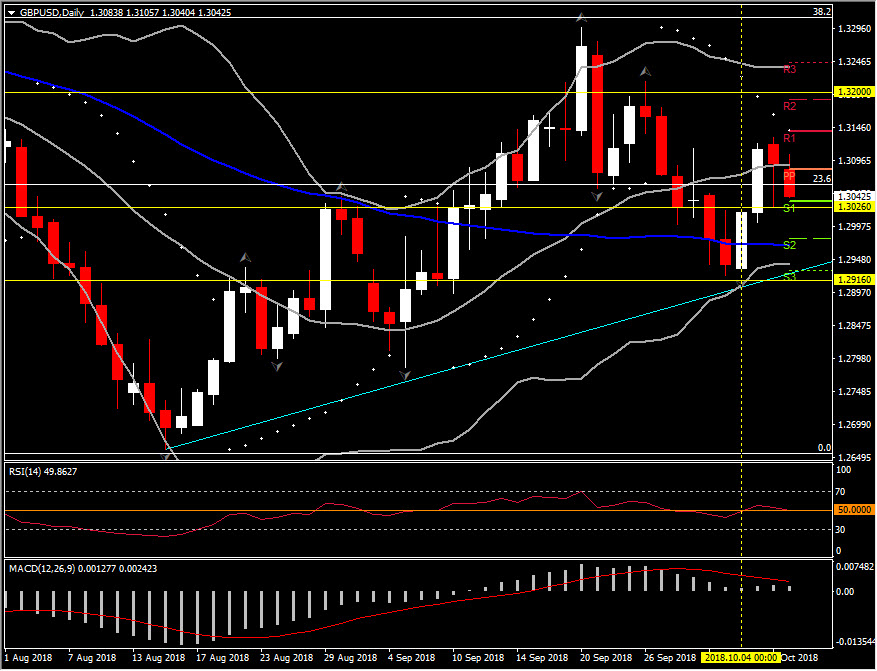
Despite the pullback seen since yesterday, GBPUSD seems to be holding some bullish momentum in the medium term, as it is still moving above 23.6% Fibonacci retracement level since April’s peak and 50-Day SMA at 1.2980. Technically, the daily indicators are sloping close to neutral zone, suggesting that upside movement since Thursday is getting weaker, however they are still configured into the positive area so far. RSI is at 51, while the MACD line is approaching the signal line but the bars of the histogram are small, confirming the weak momentum to the upside.
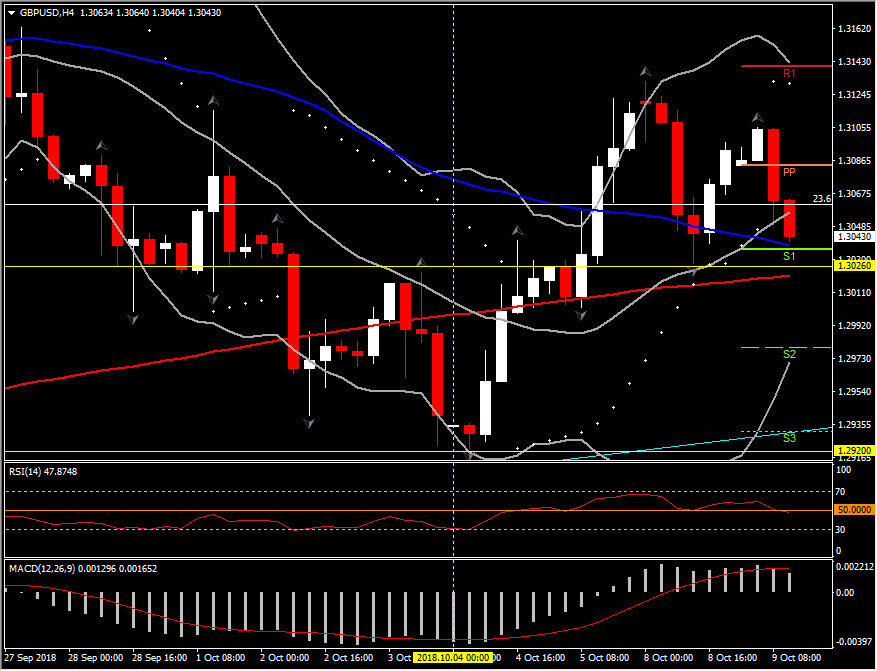
Meanwhile in the 4-hour timeframe, momentum indicators present positive to neutral picture, as RSI is at 50 zone, while MACD lines and signal line have been flattened into the positive territory, suggesting that the pair might enter a consolidation mode.
As 1.3000 is considered to be a key psychological level, trading above this level would add to the bullish bias of the asset. If bears manage to push the asset below this key level, then October lows (1.2920-1.2930 area) are likely to be retested. As medium term Support hold are 1.3000, intraday Support is set at 1.3026 level , which is the mid-point of the rally seen since Thursday.
Alternatively, if the pair is seen returning northwards, above 20-day SMA, then this could switch the outlook back to bullish and hence suggest the continuation of the uptrend. This could trigger our attention to the round 1.3200 level but more precisely to the 2-month high at 1.3297 (September 20). Intraday, 23.6% Fibonacci retracement could provide immediate Resistance level, before retesting yesterday’s peak.
Click here to access the HotForex Economic calendar.
Want to learn to trade and analyse the markets? Join our webinars and get analysis and trading ideas combined with better understanding on how markets work. Click HERE to register for FREE! The next webinar will start in:
[ujicountdown id=”Next Webinar” expire=”2018/10/09 14:00″ hide=”true” url=”” subscr=”” recurring=”” rectype=”second” repeats=””]
Andria Pichidi
Market Analyst
HotForex
Disclaimer: This material is provided as a general marketing communication for information purposes only and does not constitute an independent investment research. Nothing in this communication contains, or should be considered as containing, an investment advice or an investment recommendation or a solicitation for the purpose of buying or selling of any financial instrument. All information provided is gathered from reputable sources and any information containing an indication of past performance is not a guarantee or reliable indicator of future performance. Users acknowledge that any investment in FX and CFDs products is characterized by a certain degree of uncertainty and that any investment of this nature involves a high level of risk for which the users are solely responsible and liable. We assume no liability for any loss arising from any investment made based on the information provided in this communication. This communication must not be reproduced or further distributed without our prior written permission.


