In a previous article:
In our introduction to yield curves, we noted that the idea behind the use of a Yield Curve is to measure investors’ perception of risk and future developments both in the bond market as well as in the overall economy. Short-term bonds should carry lower yields than longer-term ones because lending to someone for a shorter period of time is less risky for the investor. As such, Yield Curves should be positive.
This behaviour is referred to as the normal yield curve, which slopes upward from left to right on the graph as maturities lengthen and yields rise. This is the usual case in most instances throughout history.
However, there are times when the yield curve becomes steeper, inverted or flatter.
Inverted Yield Curve: In periods preceding recessions, the yield curve can actually invert, with short-term bonds offering higher yields than longer-term bonds. While this appears to be counterintuitive, there is a reason this makes sense: given that lower economic growth means lower yields then bond investors seek the safety of longer-term assets for their funds. As such, demand for these bonds increases and yields decline. Given that lower yields are associated with lower interest rates and lower interest rates are usually associated with slower economic growth, an inverted yield curve is often taken as a sign that the economy may soon stagnate.
However, as in the last few days we have seen US but also Europe bond composing a steep yield curve, we decided to publish this article and podcast in order to explain the other two types of Yield curve.
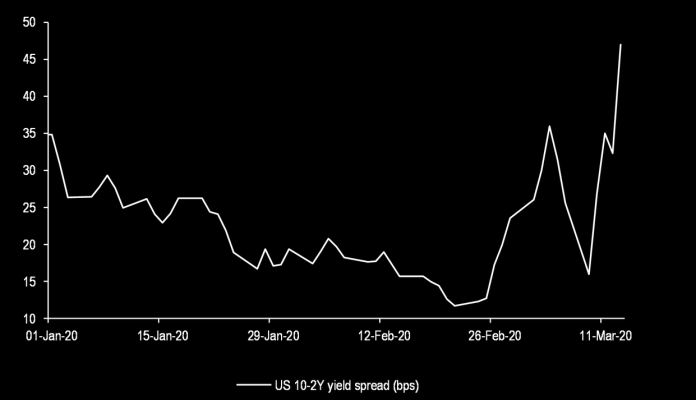
Last night, Wall Street continued to firm up on optimism the virus might be plateauing, or that at least that the worst has been seen. With that in mind, there’s increasing hope the lockdowns might be ended sooner rather than later. Stock markets posted some gains while Treasuries were mixed. Hence, the long end continued to underperform and steepened the curve out to 50 bps. But what does a steep yield curve means?
A Steep Yield curve is when the difference between the long-term and short-term bonds becomes larger. This usually occurs at the beginning of a period of economic expansion, following the end of a recession. At that point, short-term interest rates will likely be very low given that the Central Bank has lowered them to fight the recession. However, as the economy begins to grow again, many people believe that inflation will also follow suit. At this point long-term bond investors fear that they will be locked into low rates as a result of the until-then depressed rates. As a result, they demand higher rates and only commit to their funds if the long-term bonds increase their yields.
A steepening yield curve typically indicates that investors expect rising inflation and stronger economic growth.
What is a Flat Yield Curve?
A flat Yield curve, meanwhile, is the opposite of Steep Yield curve.
A flattening yield curve is when the difference between the long-term and short-term bonds becomes smaller and smaller – the curve becomes less curvy – and more flat. At this point,investors demand higher long-term rates to make up for the lost value because inflation reduces the future value of an investment. A flattening yield curve can also occur in anticipation of slower economic growth. Sometimes the curve flattens when short-term rates rise on the expectation that the Central Bank will raise interest rates.
This happens because rising interest rates cause bond prices to go down—when fixed-rate bond prices fall, their yields rise.
Click here to access the HotForex Economic Calendar
Andria Pichidi
Market Analyst
Disclaimer: This material is provided as a general marketing communication for information purposes only and does not constitute an independent investment research. Nothing in this communication contains, or should be considered as containing, an investment advice or an investment recommendation or a solicitation for the purpose of buying or selling of any financial instrument. All information provided is gathered from reputable sources and any information containing an indication of past performance is not a guarantee or reliable indicator of future performance. Users acknowledge that any investment in Leveraged Products is characterized by a certain degree of uncertainty and that any investment of this nature involves a high level of risk for which the users are solely responsible and liable. We assume no liability for any loss arising from any investment made based on the information provided in this communication. This communication must not be reproduced or further distributed without our prior written permission.


