Data starts to pick up with CPI today, along with Retail Sales and Industrial Production on Friday. The April Retail Sales are anticipated to plunge by -13.5%, with a -9.0% ex-auto drop, after respective March declines of -8.4% and -4.4%.
Mandatory shutdowns depressed retail sales components sharply, and unlike last month there was little consumer hoarding to offset declines. Vehicle sales plunged -25%, gasoline prices likely fell by -22% alongside a volume drop with reduced driving, and consumer confidence fell. Declines for construction employment and hours-worked signals downside risk for building material sales as well.
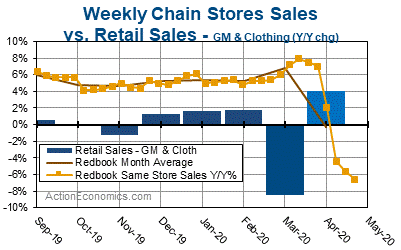
The closest correlation between weekly chain store sales and monthly retail sales is between the Johnson Redbook weekly chain store data and the General Merchandise (GM) and Clothing (Cloth) components of retail sales. Redbook growth plunged through mid-April as lockdown orders set in. This prompted the month average to plunge to -0.3% from 6.8% in March and 5.2% in February.
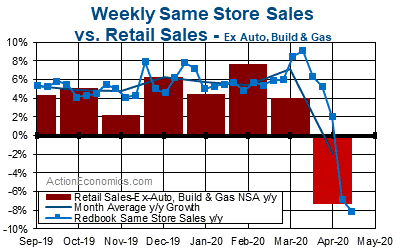 Alongside the weekly data for chain store sales there is also a Johnson Redbook weekly release on the running monthly performance of chain store sales. The two series tend to move together, but the monthly series has a slightly better correlation to core retail sales than to just general merchandise and clothing.
The gasoline service station component of retail sales largely moves with gasoline prices. The gasoline component of CPI is expected to fall -22% in April, after drops of -10.5% in March and -3.4% in February. Meanwhile, Vehicle sales fell further in April, falling to an 8.6 mln pace from 11.4 in March and 16.8 mln in February. Last but not least, in the construction sector, the changes in construction hours-worked from the monthly employment report flag movements in the building materials component of retail sales, since construction spending is expected to face a -12% drop in April. Construction jobs fell -975k after a drop of 33k in March.
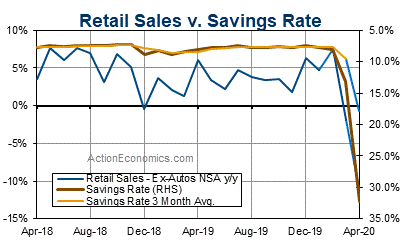
Interestingly, the savings rate is also something that is correlated with monthly retail sales, but inversely, as spending gains relative to disposable income pinch the savings residual. We expect the savings rate to surge to 28.5% from 13.1% in March and 8.0% in February, as shutdowns capped spending opportunities, while most workers continued to get paid, alongside other income boosts from the $1,200 direct payments to individuals and heightened jobless benefits with the CARES Act.
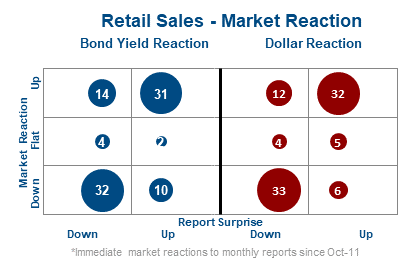
In the FX market, retail sales surprises are correlated with bond yields and FX moves. Review of a bubble graph from ActionEconomics, of immediate market movement for yields and FX compared to the surprise in the retail sales reports over the last 98 months shows that yields have reacted just slightly more to downside than upside surprises over the period, as has the Dollar, though the pattern is close to symmetric.
Click here to access the HotForex Economic Calendar
Andria Pichidi
Market Analyst
Disclaimer: This material is provided as a general marketing communication for information purposes only and does not constitute an independent investment research. Nothing in this communication contains, or should be considered as containing, an investment advice or an investment recommendation or a solicitation for the purpose of buying or selling of any financial instrument. All information provided is gathered from reputable sources and any information containing an indication of past performance is not a guarantee or reliable indicator of future performance. Users acknowledge that any investment in Leveraged Products is characterized by a certain degree of uncertainty and that any investment of this nature involves a high level of risk for which the users are solely responsible and liable. We assume no liability for any loss arising from any investment made based on the information provided in this communication. This communication must not be reproduced or further distributed without our prior written permission.


