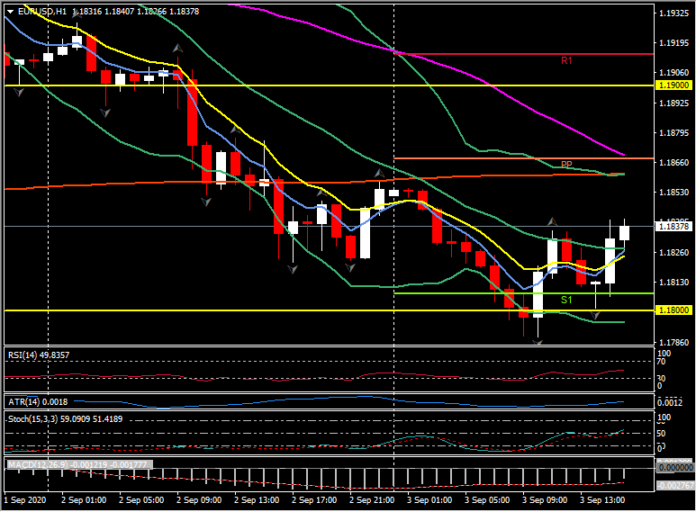
EURUSD, H1
Claims:
The -130,000 initial claims drop to 881,000 in the week of hurricane Laura extended the -93,000 decline to 1.011 million in the prior week from 1.104 million in the BLS survey week, leaving a big drop that was likely due to the shift in the seasonal adjustment process from multiplicative to additive seasonal factors.
We also saw -1.238 million continuing claims drop to 13.254 million, after the usual downward revision that left a -266,000 decline to 14.492 million. The revised data leave a big -2.459 million continuing claims drop between the July and August BLS survey weeks, following a -2.280 million decline from June to July, and a -1.610 million drop from May to June.
Initial claims are averaging 999,000 in August, versus prior averages of 1.340 million in July, 1.478 million in June, 2.322 million in May, and a 4.572 million peak in April, versus a cycle-low of just 211,000 in January.
The 1.104 million August BLS survey week reading undershot recent survey week levels of 1.422 million in July, 1.540 million in June, 2.446 million in May and 4.442 million in April.
The insured jobless rate fell to 9.1% from 9.9%, versus a 17.1% peak in the second week of May and a 1.2% cycle-low for nearly two years ending in mid-March.
The claims data were not back-revised with the new seasonal adjustment procedure, but we now know that the labor market was probably tightening over the July-August period by more than the reported data show, as evident with the tighter NSA data, given that we probably should have been using additive seasonal factors.
Trade Balance:
The US trade deficit widened by much more than expected to 12-year high of $63.6 bln from $53.5 (was $50.7) bln in June and a 17-month high of $57.9 (was $54.8) bln in May, with upward revisions for the deficits in all the months of 2020 due to much lower export levels and modestly lower import levels.
Exports increased 8.1% to $168.1 bln, after bouncing 9.6% to $155.5 bln (was $158.3 bln) in June. Imports climbed 10.9% to $231.7 bln, following a 4.6% rebound to $208.9 bln previously.
Excluding petroleum, the July deficit rose to -$65.7 bln from -$54.8 bln (was -$52.0 bln) in June. The “real” goods deficit widened to -$90.5 bln versus -$80.3 bln in June (was -$81.0 bln).
Because all the trade deficits in 2020 were widened by a similar amount, the impact on the expected Q2 GDP revision, and prospects for Q3 GDP growth, are somewhat ambiguous.
Productivity:
The productivity report revealed a big 2.8% Q2 growth boost to 10.1% from 7.3%, following a -0.3% Q1 drop. We saw a -37.1% (was -38.9%) Q2 contraction rate for the BLS output measure, as implied by the last round of GDP data, following a -6.4% Q1 figure.
We saw a -42.9% (was -43.0%) Q2 drop in hours-worked, following a -6.1% figure in Q1. We saw Q2 growth in compensation per hour of 20.0% (was 20.4%), after a 9.2% (was 9.4%) Q1 clip as implied by the last round of income revisions. The mix left Q2 unit labor cost growth of a revised 9.0% (was 12.2%), after a 9.6% (was 9.8%) Q1 clip.
The productivity data will likely remain quite volatile on a quarterly basis through the pandemic, and don’t tell us much about what is happening in the economy until we get quite a few more quarterly readings.
The Dollar headed slightly lower after the mix of data, where initial and continuing jobless claims were better than expected, the trade deficit blew out much more than expected, and productivity was revised higher. EURUSD topped over 1.1848 from 1.1815, as USDJPY dipped from over 106.50 toward 106.35.
Click here to access the HotForex Economic Calendar
Stuart Cowell
Head Market Analyst
Disclaimer: This material is provided as a general marketing communication for information purposes only and does not constitute an independent investment research. Nothing in this communication contains, or should be considered as containing, an investment advice or an investment recommendation or a solicitation for the purpose of buying or selling of any financial instrument. All information provided is gathered from reputable sources and any information containing an indication of past performance is not a guarantee or reliable indicator of future performance. Users acknowledge that any investment in Leveraged Products is characterized by a certain degree of uncertainty and that any investment of this nature involves a high level of risk for which the users are solely responsible and liable. We assume no liability for any loss arising from any investment made based on the information provided in this communication. This communication must not be reproduced or further distributed without our prior written permission.


