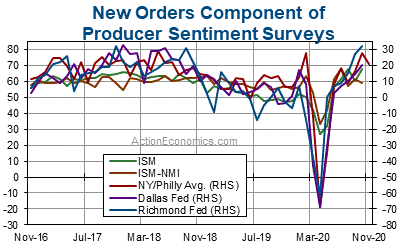
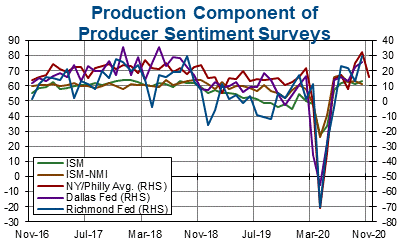
Producer sentiment is poised for a November pull-back to still elevated levels, with headwinds from rising COVID-19 fears and emerging lockdown disruptions. The early month components were broadly lower, and hence the ISM-adjusted average of the major sentiment indexes is expected to moderate to a still-solid 57 from 58 in October, 56 in September, and 54 in both August and July. Upward pressure on production remains in place due to lean inventories and continued strong sales, despite new restrictions on travel and restaurant activity.
For the Empire State report, the headline dropped to 6.3 from 10.5 in October, and 17.0 in September. April’s -78.2 headline marked an all-time low. The Philly Fed headline fell to 26.3 after surging to 32.3 from 15.0 in September. In Philly’s case, the April -56.6 headline was a low back to July of 1980. The component series in the two November reports also mostly exhibited pull-backs, prompting declines in the ISM-adjusted measures for both releases.
The various components of the Empire State and Philly Fed reports are correlated with their counterparts in the later month releases, and this correlation is stronger when the respective components of the Empire State and Philly Fed are averaged together. The production components from the two releases both declined sharply, while despite declines elsewhere, the various employment components were mostly higher on the month.
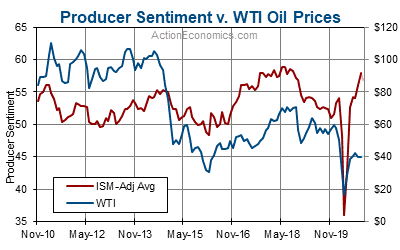
Producer sentiment meanwhile, has moved with oil prices over the past decade, as the US factory sector is increasingly exposed to the oil industry. The big oil price drop in 2014-15 pulled the ISM-adjusted average of the producer sentiment measures off its short term peak of 55.2 in July of 2014 to a low of 48.5 in February of 2016 that corresponded with the bottom in oil prices. Producer sentiment rose to remarkably high levels through late-2018 with resumed firmness in oil prices to a peak for the ISM-adjusted average of 58.8 in May of 2018 before a gradual moderation. Oil prices plunged in 2020 with the COVID-19 pandemic and OPEC price war, before rebounding over the summer, leaving a similar gyration for the sentiment measures, though price appreciation has now stalled.
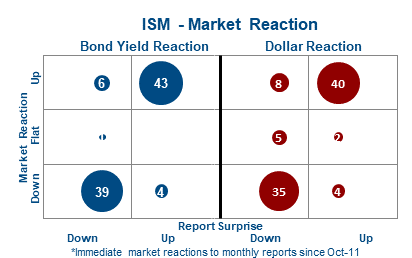
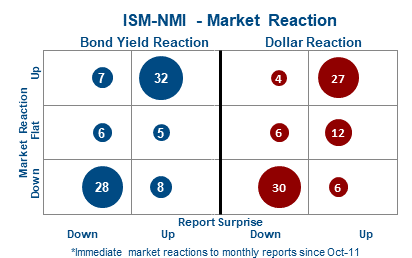
The historical impact of surprises in the producer sentiment reports on bond yields and the Dollar varies across the remaining reports for the month. Bubble graphs from Action Economics, show the immediate reaction in yields and FX moves to headline surprises to the upside or downside for the remaining reports. The Chicago-ISM has the weakest correlation with FX moves, but is strongly correlated with yield swings. The yield relationship to downside surprises is slightly stronger than with upside surprises.
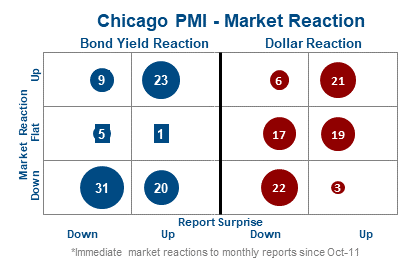
The ISM is as correlated with yields, as is the Chicago-ISM. But, unlike the Chicago-ISM, we see more consistent reactions in FX moves when the ISM beats expectations. The ISM-NMI also has a strong correlation with yields, though this correlation is weaker than with the ISM and Chicago PMI. The ISM-NMI and ISM have the best correlation of these reports with FX moves.
Nevertheless, the early-month surveys of producer sentiment revealed declines across the major components and headlines, with headwinds from rising COVID-19 fears and emerging lockdown disruptions. The impact of COVID-19 peaked in April with shutdowns fully in effect, and a rebound through Q3 and into Q4, as sales rose and inventories fell.
Click here to access the Economic Calendar
Andria Pichidi
Market Analyst
Disclaimer: This material is provided as a general marketing communication for information purposes only and does not constitute an independent investment research. Nothing in this communication contains, or should be considered as containing, an investment advice or an investment recommendation or a solicitation for the purpose of buying or selling of any financial instrument. All information provided is gathered from reputable sources and any information containing an indication of past performance is not a guarantee or reliable indicator of future performance. Users acknowledge that any investment in Leveraged Products is characterized by a certain degree of uncertainty and that any investment of this nature involves a high level of risk for which the users are solely responsible and liable. We assume no liability for any loss arising from any investment made based on the information provided in this communication. This communication must not be reproduced or further distributed without our prior written permission.


