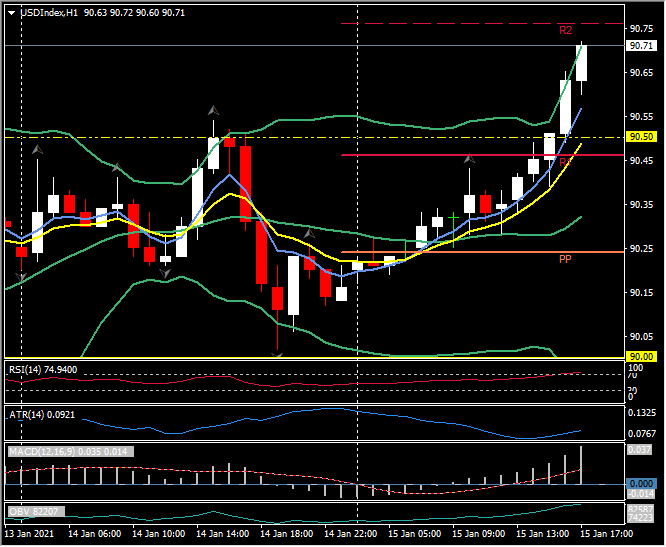
USDIndex, H1
US Retail sales fell -0.7% in December and declined -1.4% excluding autos, much weaker than projected. November sales dropped -1.4% (was -1.1%) with the core rate off -1.3% (was -0.9%). Sales have declined for three straight months. Excluding autos, gas, and building materials declined -2.3% from -1.5% (was -1.0%) previously. Much of the weakness was in non-store retailers where sales plunged -5.8% from -1.6% (was 0.2%). Department store sales also dropped -3.8% from -7.6% (was -7.7%). Electronics slid -4.9% after the prior -8.3% (was -3.5%) tumble. Sales at restaurants and bars fell -4.5% from -3.6% (was -4.0%). Food, beverage sales down -1.4% from 1.5% (was 1.6%) Gas station sales rebounded 6.6% versus -1.6% (was -2.4%). Building materials edged up 0.9% from 0.8% (was 1.1%). Clothing sales increased 2.4% from -6.1% (was -6.8%). Health and personal care bounced 1.1% from -0.4% (was -0.7%).
US December PPI rose 0.3% and was up 0.1% excluding food and energy. November posted 0.1% gains for both. On a 12-month basis, headline prices were steady at 0.8% y/y, and the core rate dipped to a 1.2% y/y pace versus 1.4% y/y previously. Goods prices were 1.1% higher after edging up 0.4% previously. Energy prices jumped 5.5% compared to the prior 1.2% gain, while food prices slipped -0.1% after November’s 0.5% gain. Services prices eased -0.1% after the unchanged reading previously.
The US Empire State Manufacturing Index fell another -1.4 ticks to 3.5 in January, weaker than expected after sliding the same -1.4 points to 4.9 last month. This is a fourth straight monthly decline to the lowest since August, although it remains in expansionary territory for a seventh straight month. It was at 4.8 last January. The employment index dipped to 11.2 from 14.2, with the latter the highest since December 2018. The workweek rose to 6.3 from 4.8. Also new orders increased to 6.6 from 3.4. Shipments fell to 7.3 from 12.1. Prices paid jumped to 45.5 from 37.1 and prices received climbed to 15.2 from 10.0. The 6-month activity index declined to 31.9 versus 36.3, which was at 56.5 in June (the best since October 2009). For the future components, the employment gauge was improved to 23.0 versus 21.3, with new orders at 34.8 from 32.3, prices paid edged up to 49.0 from 48.6, and prices received declined to 23.4 from 30.0. Capex increased to 17.9 from 16.4.
However, US industrial production surged 1.6% in December, with capacity utilization rising to 74.5%, both much stronger than expected. Production was up 0.5% (was 0.4%) in November and 1.0% (was 0.9%) in October. November capacity use was revised up to 73.4% (was 73.3%). Manufacturing increased 0.9% after the prior 0.8% gain. That included a -1.6% drop in motor vehicles and parts versus the 5.0% (was 5.3%) gain previously. Excluding vehicles/parts, manufacturing was up 1.1% versus 0.5% (was 0.4%). Machinery production climbed 2.1% versus -1.0% (was -0.5%). Computer, electronics manufacturing fell -0.6% from 0.9% (was 1.1%). Utilities surged 6.2% from -4.5% (was -4.3%). Mining increased 1.6% after rising 2.8% (was 2.3%) previously.
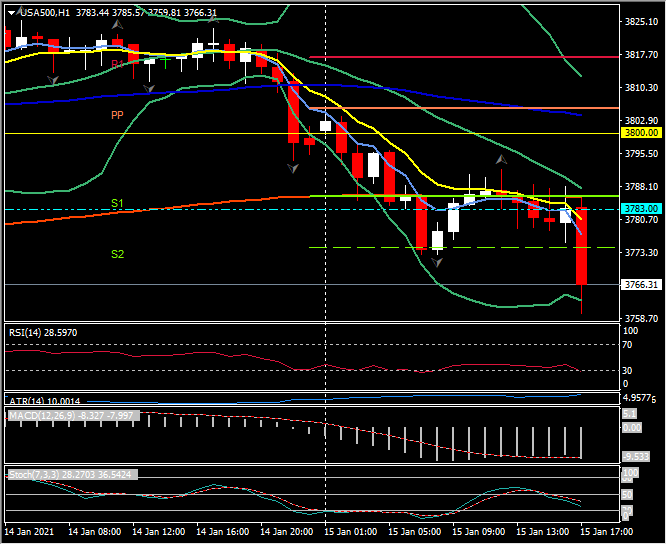
US Equities have opened the final trading day of the week mixed with a “sell the news” trade in play following the details of President-elect Biden’s $1.9tln “American Rescue Plan.” But despite control of the executive and legislative branches of government, there is some uncertainty over the prospect that the full package will make it through Congress. The tax implications are also being mulled. Meanwhile, news on the virus remains grim globally even as vaccines continue to underpin expectations that a return to normal activities is possible by the second half of this year. The USA30 opened -170 points or -0.55% at 30,823, USA100 +15 points or +0.12% at 13,128 and the USA500 -29 points at 3,766.
The Dollar continues to gain on the day, up 0.35% against the EUR, 0.56% against Sterling and flat versus the Yen. The AUD and Kiwi are the biggest Dollar losers today, down 0.85% and 0.93% respectively, as the USDIndex, once again breaks 90.50.
Click here to access the HotForex Economic Calendar
Stuart Cowell
Head Market Analyst
Disclaimer: This material is provided as a general marketing communication for information purposes only and does not constitute an independent investment research. Nothing in this communication contains, or should be considered as containing, an investment advice or an investment recommendation or a solicitation for the purpose of buying or selling of any financial instrument. All information provided is gathered from reputable sources and any information containing an indication of past performance is not a guarantee or reliable indicator of future performance. Users acknowledge that any investment in Leveraged Products is characterized by a certain degree of uncertainty and that any investment of this nature involves a high level of risk for which the users are solely responsible and liable. We assume no liability for any loss arising from any investment made based on the information provided in this communication. This communication must not be reproduced or further distributed without our prior written permission.


