


Fluor Corporation is a holding entity that operates in four major segments:
- Energy and chemical
- Industrial, mining, infrastructure and power
- Different services
- Government
The company offers professional services of fabrication, construction, procurement and engineering services on an international basis.
Earnings Preview
The corporation will publish its earnings report for the first quarter on Friday, Feb 26, 2021. The share price of the company is around $19, near the 52-week high of $21.
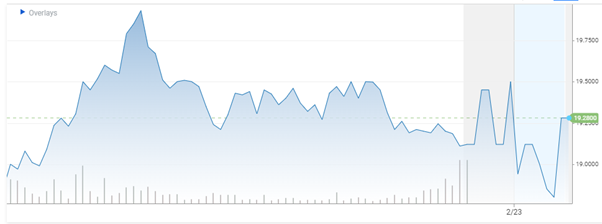
Source: CNBC.com
The report will cover the fiscal quarter that ended January 21. According to MarketBeat, there are only two analysts that recorded their opinion on the earnings forecast of the Fluor Corporation. The company has rating of 2.17 out of 5 based on one Buy rating and 5 Hold ratings while there is no Sell rating. According to the official website of Fluor, the analyst rating is 3 out of 5 which means that the stance on the stock is neutral.
Key Stats
- Average volume: 2.16 million shares
- Market cap: $2.69 billion
- PE Ratio: not applicable
- Dividend yield: not applicable
- Earnings per share: $0.14
- One-year change: 19.7%
- Beta: 2.85
Estimate
According to Investing.com, the estimated earning per share for the company is 0.2215 while the estimated revenue for the period is $3.69 billion. Meanwhile the earning per share of the previous quarter was estimated at 0.2815 while the actual EPS came in at 0.14.
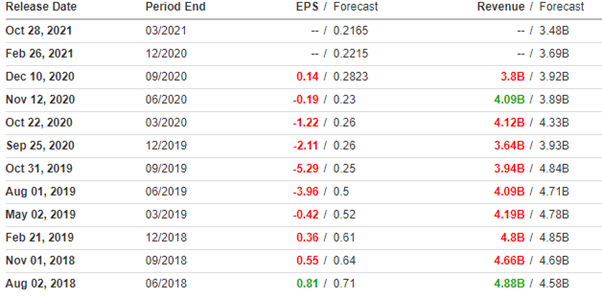
Source: Investing.com
The above table clearly reveals that there is a consistent downtrend in the actual EPS and revenue of the company. According to the company’s official website, out of the last four estimates of EPS one points at up while none point at the downside. The high was 0.27 while the low was 0.10 and the median is 0.14. According to MarketBeat, the analysts have consensus on the share price target of $13 which is 31% down from the current $19.
In the last two years, the company managed to beat the estimate once in revenue but could not beat any estimate of EPS. The earnings per share of the company has been constantly dropping over the past two years.
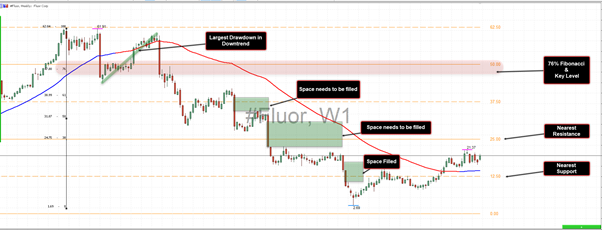
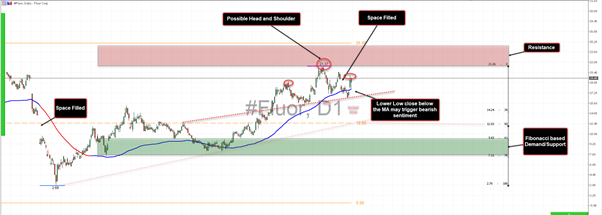
Technical Analysis
The chart of Fluor Corporation gives a very clear picture of the market condition. The daily chart reveals increasing volume with bullish candles while the immediate resistance for the price is slightly above $20 ahead of the 52-week high around $21. The price is comfortable above the 20-day simple moving average while the recent daily candle has a long shadow on the downside. This is a strong bullish sign.
In the past three earning reports published, the share price rose twice after the release of reports. On the downside, immediate support lies at $16.5 ahead of $15.5 where buying interest can be observed.
Click here to access our Economic Calendar
Adnan Rehman
Regional Market Analyst
Disclaimer: This material is provided as a general marketing communication for information purposes only and does not constitute an independent investment research. Nothing in this communication contains, or should be considered as containing, an investment advice or an investment recommendation or a solicitation for the purpose of buying or selling of any financial instrument. All information provided is gathered from reputable sources and any information containing an indication of past performance is not a guarantee or reliable indicator of future performance. Users acknowledge that any investment in Leveraged Products is characterized by a certain degree of uncertainty and that any investment of this nature involves a high level of risk for which the users are solely responsible and liable. We assume no liability for any loss arising from any investment made based on the information provided in this communication. This communication must not be reproduced or further distributed without our prior written permission.


