The Nonfarm Payrolls number is expected to reflect the growth of the US economy in every aspect affected by the pandemic since last year. Since last summer, the US labor market appeared to spark signs of optimism, as more than half of lockdown job losses had been replaced by October and jobless claims had halved from July. By the end of 2020 however all these had reversed aggressively, with payrolls and jobless claims collapsing again on the closing of several states’ economy on the rising of new virus cases, spike in hospitalization.
This time, however, things are different as in 2021 the US economy looks to be on a point of transition with economic data supporting markets’ hasty optimism, backing by the ease of Covid-19 cases and the significant progress in the vaccination program which strengthens the recovery of the US labor market with or without the massive fiscal stimulus pointed by President Biden.
Market forecasts have nearly doubled February’s evolvent in March as estimates raced above the 500k March Nonfarm Payroll over the past two weeks, as economists take “the over” in the face of producer sentiment gains, a tightening in claims, and room for what proved a huge February weather-hit by most measures. The forecast is ranging between 500k – 640k. The risk is upward, but the 4.3% GDP forecast is consistent with a 500k gain. Overall a larger 600k-700k payroll gains is seen through Q2, as growth ramps up. We expect a workweek rise to 34.8 and gains of 1.0% for hours-worked and 0.1% for hourly earnings, alongside a jobless rate drop to 6.1%.
Markets’ hasty optimism is further supported by President’s Biden goal to offer immunization to every American by May 1. At the current pace, doses will reach the arms of half of the US by May 9. Hence, this goal looks to be feasible as more and more states have already achieved that milestone. Hence, along with economic data that present the US economic growth a step ahead of other nations, along with fast vaccination, the cancellation of all restrictions (i.e. Texas), the drop of the weekly jobless claims have convinced investors to start pricing in the US recovery.
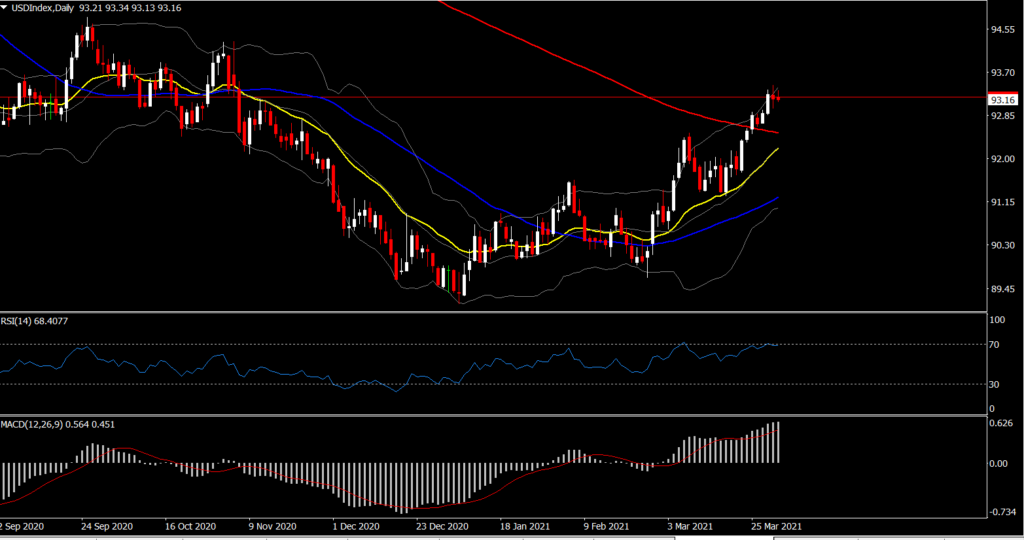
Hence on top of all, the overall labor market outlook for Q2 looks promising since a combination of an accommodative monetary policy and the additional $1.9 trillion fiscal support comes into play, something that could produce stronger economic readings in the coming months. Hence an upwards surprise on tomorrow’s NFP might not be as exaggerated as initially thought, but it may spike volatility for the US Dollar given the low liquidity during the Easter holidays.
Jobs data breakdown
On the flip side, the participation rate has been stable since July despite the upward-trending job numbers, likely providing some warnings that misclassification errors may be understating the real unemployment numbers. It is likely that millions of people are not actively seeking a job, and therefore are not considered as unemployed, as the uncertainty around the virus development, the disappearance of employment opportunities, and virtual schooling, which forced some parents to stay at home, have likely pushed this group of people out of the labor force. Hence, the headline unemployment rate may be an incomplete guide to the trajectory of the labor market, somewhat explaining the Fed’s decision to maintain its policy accommodative at current levels until it meets its target of full employment conditions.
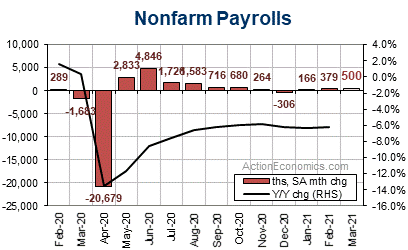
The 500k Nonfarm payroll estimates assumes a 490k private jobs increase. The goods based employment increase is pegged at 100k, after a -48k decrease in February. Construction employment is seen rising 55k, after a dip of 61k in February and a 1k uptick in January, while factory jobs rise 40k, after a 21k increase in February, and a -14k decrease in January. These are based on assumptions of a private service job increase of 390k in February, after a 513k jump in February and a 10k increase in government employment.
Seasonal Trends and Weather
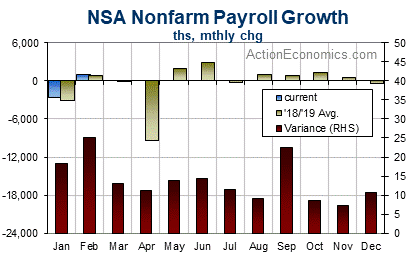
The graph below shows the two-year average NSA payroll change for each month, pre-2020. The seasonal impact through the year on payroll changes is mostly positive, but is negative in December, January and July. Distortions of last year’s COVID-19 hit have produced negative averages for March and April now as well. The NSA average drops to -171k in March from 859k in February, and -3,026k in January. The red bars show each month’s variance. After a first-half peak in February, variance decreases over the spring before reaching a second-half peak in September.
For disruptions to employment from weather as gauged in the household survey, the biggest disruptions occur in the winter months generally with the average peaking in February. There is an additional climb through the late-summer months due to disruptive hurricanes in some years.
Hourly Earnings
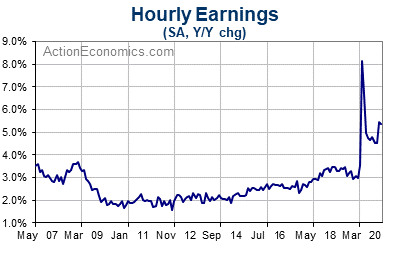
A 0.1% rise for March average hourly earnings is anticipated, after gains of 0.2% in February, 0.1% in January, and 1.0% in December, with swings that likely still largely reflect the percentage of lower paid workers in the jobs pool, as seen with the 4.7% surge last April and the 1.0% pop in December. A 4.5% y/y increase in March is seen, which is down from 5.3% in February. Growth in hourly earnings was gradually climbing from the 2% trough area between 2010 and 2014 to the 3%+ area until the economy’s plunge with the pandemic. The y/y wage gains will be distorted through 2021 via the base effect from last year’s wage spike and ensuing unwind.
ADP
The 517k March ADP rise nearly matched market’s 490k private BLS payroll estimate with a 500k total BLS payroll gain, after a boost in February’s ADP rise to 176k from 117k that narrowed the gap to the 465k BLS private payroll increase. The March ADP figures revealed the largely expected 80k rise for goods sector jobs, but a hefty 437k gain for service sector jobs. The service sector gain included outsized increases of 169k for leisure and hospitality, 92k for trade, transportation and utilities, 83k for professional and business services, and 68k for education. The “as reported” ADP figures undershot the BLS payroll data in February, overshot in the prior two months, but undershot dramatically in the previous months of the pandemic, leaving a big net undershoot of BLS payroll swings over the past year. Given this tendency for an ADP undershoot, this data signal slight upside risk to the 500k payroll forecast.
Consumer Confidence
All the confidence measures are climbing into the end of Q1 alongside vaccine distributions, another round of stimulus deposits, and the easing of coronavirus restrictions, after a prior modest downward tilt into the holidays. The Conference Board’s consumer confidence index should improve to a 5-month high of 96.0 from 91.3 in February, versus a seven-month high of 101.4 in October. Michigan sentiment rose to 1-year high of 84.9 from 76.8 in February, versus a 2-year high of 101.0 in February of 2020. The IBD/TIPP index rose to a 1-year high of 55.4 from 51.9, versus a 16-year high of 59.8 in February of 2020. The Langer (formerly Bloomberg) Consumer Comfort index is poised for a 1-year high 49.0 average in March, from 46.7 in February. We saw a 67.3 weekly prior-cycle high in late-January of 2020.
Conclusion
The March payroll forecasts is for a 500k increase, though market estimates have spiked higher over the past few weeks, as available March data confirm that disruptions from the pandemic are diminishing alongside the boost from stimulus payments. We expect a 34.8 workweek in March with a 1.0% hours-worked figure, and an hourly earnings rise 0.1%. The jobless rate should tick down to 6.1% from 6.2% in February.
Click here to access our Economic Calendar
Andria Pichidi
Market Analyst
Disclaimer: This material is provided as a general marketing communication for information purposes only and does not constitute an independent investment research. Nothing in this communication contains, or should be considered as containing, an investment advice or an investment recommendation or a solicitation for the purpose of buying or selling of any financial instrument. All information provided is gathered from reputable sources and any information containing an indication of past performance is not a guarantee or reliable indicator of future performance. Users acknowledge that any investment in Leveraged Products is characterized by a certain degree of uncertainty and that any investment of this nature involves a high level of risk for which the users are solely responsible and liable. We assume no liability for any loss arising from any investment made based on the information provided in this communication. This communication must not be reproduced or further distributed without our prior written permission.


