On Thursday 20 May, Applied Materials and Ralph Lauren Corporation (#RalphLauren) are scheduled to release their earnings reports, with the former announcing its Q2 result after market close, and the latter announcing its fourth quarter fiscal 2021 results before market open.
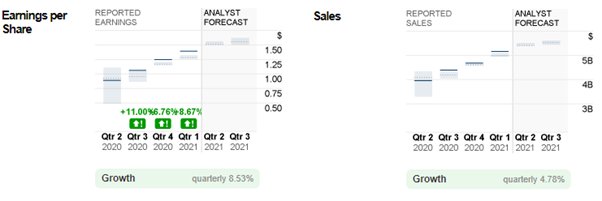
Applied Materials, one of the bellwethers in the semiconductor industry specializing in selling tools that are utilized globally to manufacture chips and advanced display, has continued to see its value appreciate following ongoing demand and consumption of silicon across a wide range of markets and applications. In the previous quarter, the company recorded $5.16B in sales, up 24% (y/y) while non-GAAP earnings per share (EPS) also increased by 42% (y/y) to $1.39.
For the upcoming announcement, consensus estimates for EPS stand at $1.51, up 8.6% (q/q) and 69.7% (y/y), while sales are expected to hit $5.4B, up 3.8% (q/q) and 35.0% (y/y).
Looking ahead, market sentiment remains positive, taking into account the company’s portfolio strength, increasing deployment of 5G in key markets, growth opportunities across specialty nodes, and solid customer momentum across automotive and advanced packaging, as well as growing research and development activities in IoT, AI and Big Data. These tailwinds would continue to support the overall performance of the company.
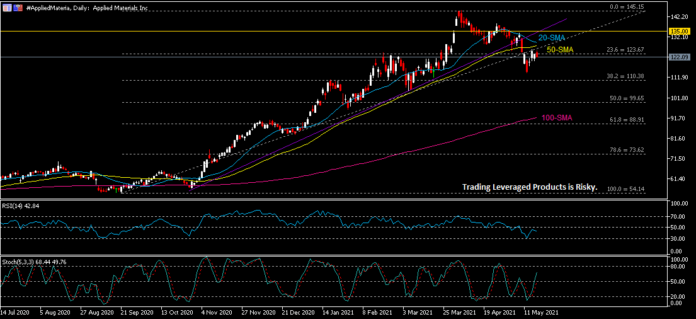
In general, 21 out of 26 polled investment analysts has rated a Buy for Applied Materials, with median target of $160, indicating there is still nearly 30% growth from the current price. From the technical point of view, the #AppliedMateria share price has been riding on a bullish trend after successfully breaking the ATH seen in August 2020, at $69.89. The share price has undergone its first technical correction following the closure of candlesticks below the ascending trend line and 23.6% Fibonacci retracement level, or $123.70. However, the bearish momentum was not strong enough to further drag the share price lower. Instead, it rebounded together with the RSI and Stochastic Oscillator indicators after printing a low at $114.33, currently retesting the 23.6% FR level. Above this level, there lies 20-SMA (blue) and 50-SMA (yellow). If the two MA lines form a death cross, the share price may be under pressure, regardless of whether it has successfully broken above the two moving averages. Nevertheless, if the attempt to form a death cross is unsuccessful, breaking above $135 would probably trigger another round of bullish traction towards the next resistance, at $145. Major support levels are $110.40 and $99.65, which correspond to 38.2% FR and 50.0% FR respectively.
Ralph Lauren Corporation
If you are a fan of American sitcom “Friends”, it is very unlikely that you are not familiar with Ralph Lauren. Ralph Lauren has been in business for over 50 years, selling mainly mid-range to luxurious apparel, footwear, accessories, and fragrances.
Looking at the previous year, Ralph Lauren has done exceptionally well in the second quarter, with EPS jumping almost 180% (q/q), from $-1.82 to $1.44, while reported sales surged by over 140% (q/q), to $1.2B. The outstanding results, as stated by the company’s news releases, were mainly contributed by its “continued focus on brand elevation and creating immersive lifestyle experiences that are amplified across our stores, and digital marketing and commerce channels around the world, while also maintaining expense discipline”.
However, consensus estimates are pessimistic regarding the upcoming announcement of EPS and sales. The former is expected to plunge by more than 140% (q/q), or -5.9% (y/y), to $-0.72, while sales is expected to drop by 14.3% (q/q) ,or -7.7% (y/y), to $1.2B. Underlying reasons could be reduced or temporary closure of stores and facilities during the pandemic, changes in higher-level management team, shifting consumer preferences, increasing challenges from competitors, trade regulations and many more.
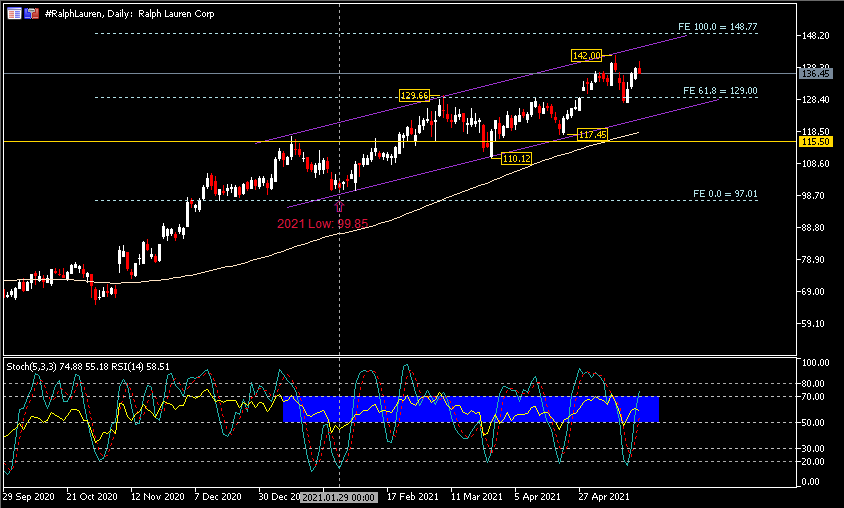
From the Daily chart above, the #RalphLauren share price remains traded within an ascending channel, with the formation of the first low (and the lowest YTD in 2021) at $99.85 (29 January), following its retrace from the session high $115.50. The company’s share price printed its latest high at $142.00, which is approximately 5% higher than 12-month median price estimates offered by 17 analysts. While traded along the channel, the RSI indicator remains oscillating between 50 and 70, suggesting ongoing upward bias. In the near term, resistance levels to watch are $142.00 and $148.75 (in line with 100% Fibonacci expansion level and upper trend line of the ascending channel). $129.00 (or FE 61.8%) remains a key support. A successful breakout below the support may indicate the possibility for the share price to extend its losses towards the lower trend line of the ascending channel, 100-SMA and $115.50.
Click here to access our Economic Calendar
Larince Zhang
Regional Market Analyst
Disclaimer: This material is provided as a general marketing communication for information purposes only and does not constitute an independent investment research. Nothing in this communication contains, or should be considered as containing, an investment advice or an investment recommendation or a solicitation for the purpose of buying or selling of any financial instrument. All information provided is gathered from reputable sources and any information containing an indication of past performance is not a guarantee or reliable indicator of future performance. Users acknowledge that any investment in Leveraged Products is characterized by a certain degree of uncertainty and that any investment of this nature involves a high level of risk for which the users are solely responsible and liable. We assume no liability for any loss arising from any investment made based on the information provided in this communication. This communication must not be reproduced or further distributed without our prior written permission.


