


Recent economic data has provided a clearer picture of the strengthening of the eurozone economy, with the June Eurozone manufacturing PMI holding steady at 63.1. Although there was no improvement in the manufacturing index during the month, its ability to remain stable provides a promising picture of progress in moving forward, as with much of the rest of the world.
What is encouraging is the rise in the services PMI to 58.0, the highest level since 2018. The services PMI fell below the key 50 level in September 2020 and remained in contraction territory until April 2021, when it hit 50.5. May and June have shown much stronger readings in a time of broader recovery with a decline in virus cases and an increase in vaccinations accompanied by periodic easing of restrictions.
The issue of eurozone inflation so far has not been as hot as in the US, where May headline CPI inflation was at 2.0% and core at just 1.0%. This slower rate of inflation makes sense given that Europe has generally been slower to vaccinate its citizens than the US and UK, and government restrictions are taking longer to enforce. This week’s CPI for June will offer an early look at price pressures as Europe goes through the reopening process.
Technical Levels
EURUSD – The sharp decline partially reversed last week by 0.66% after forming a higher low at 1.1846 previously. Now the asset is trading below the psychological 1.2000 (50.0%FR).
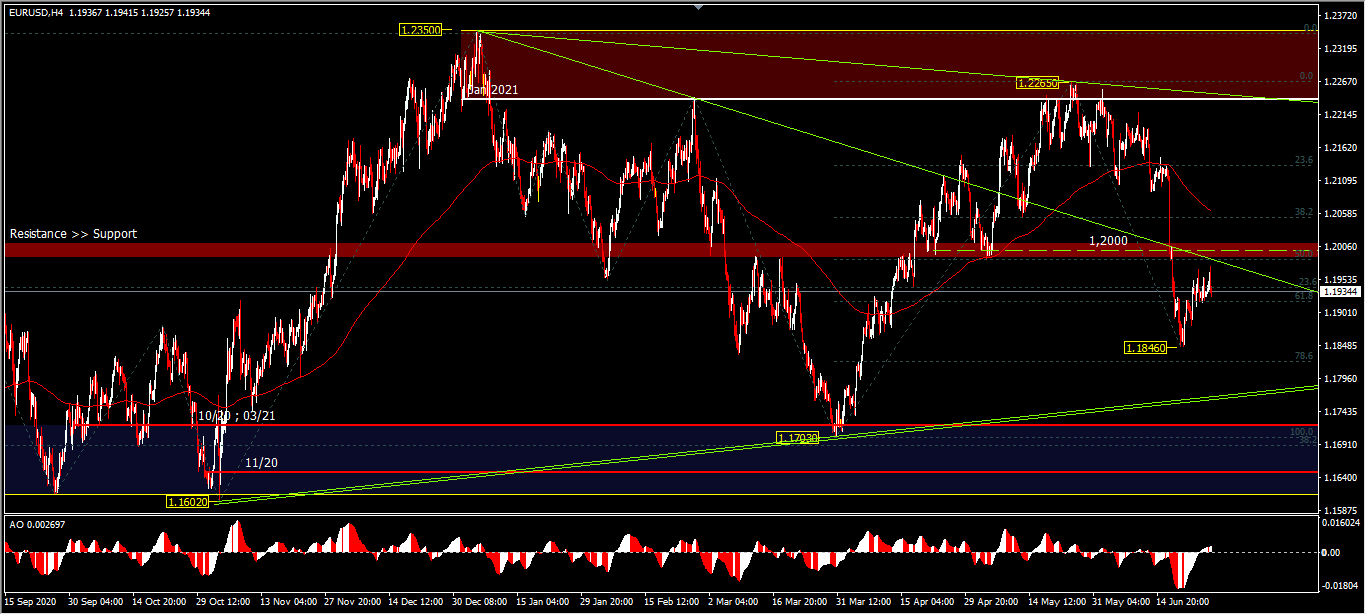
The intraday bias still looks neutral for now and there is a tendency to the downside, after last week was not strong enough to lift the price to psychological levels. A break of 1.1846 will continue the decline of 1.2265, as the second descending wave of the ongoing consolidation pattern. On the upside, a move above the psychological 1.2000 level is likely to equalize the downside position seen during the FOMC news release 2 weeks ago, at the price range of 1.2100, and if it is strong enough it will equalize the resistance position at 1.2265.
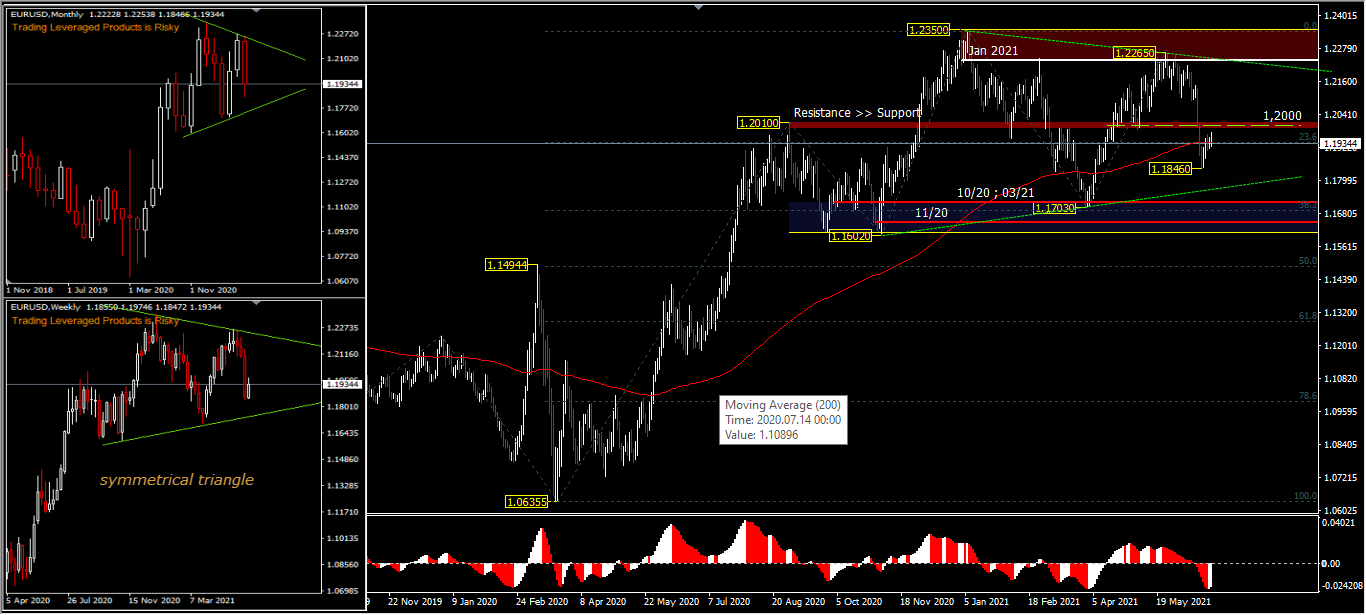
EURUSD in the big picture (D1) is accelerating at the 200-day EMA with AO histogram validation on the downside. The slope of the EMA line still does not show curvature and the pattern looks likely to form a symmetrical triangle, which can be seen in the distance of the price range getting sharper to the side. This asset requires continued consolidation to produce a trend change. A move below the 1.1602 support would confirm a change in the uptrend for a deeper retracement to the 50.0% FR level at 1.1494. A move above the temporary peak of 1.2350 would strengthen the rally position of 1.0635 to the peak cluster of February 2018 (1.2555).
Click here to access our Economic Calendar
Ady Phangestu
Analyst – HF Indonesia
Disclaimer: This material is provided as a general marketing communication for information purposes only and does not constitute an independent investment research. Nothing in this communication contains, or should be considered as containing, an investment advice or an investment recommendation or a solicitation for the purpose of buying or selling of any financial instrument. All information provided is gathered from reputable sources and any information containing an indication of past performance is not a guarantee or reliable indicator of future performance. Users acknowledge that any investment in Leveraged Products is characterized by a certain degree of uncertainty and that any investment of this nature involves a high level of risk for which the users are solely responsible and liable. We assume no liability for any loss arising from any investment made based on the information provided in this communication. This communication must not be reproduced or further distributed without our prior written permission.


