


Yesterday, the electric car giant Tesla (#Tesla) announced its second quarter financial report as scheduled. After Tesla reported for the first time in the last three months that its car payment volume exceeded 200,000 (or a year-on-year increase of more than 120%), the company’s performance in the second quarter earnings report lived up to expectations, and it also broke many records as highlighted in this summary. The details are as follows:
Total revenue was US $11.958 billion, an increase of 15.10% from the previous quarter and a surge of 98.11% year-on-year. A larger part of this revenue comes from the Total Automotive Revenue, which is 10.21 billion US dollars. This is the first time it has exceeded the 10 billion US threshold in history. It reflects that even under the influence of various internal and external factors, the market demand for cars is still strong. Other revenue-generating parts include Energy generation and storage, and Services and other, which were US $8.01 billion each [62.15% increase from the previous quarter; 116.49% year-on-year increase] and 9.51 billion US dollars [an increase of 6.49% from the previous quarter; a year-on-year increase of 95.28%].
Boosted by the increase in vehicle deliveries (Model 3 and Model Y accounted for more than 99% of total sales; a total of 201,304 vehicles were delivered, an increase of 8.89% from the previous quarter, but a surge of 121.48% year-on-year), the revenue from auto sales alone reached 9.874 billion US dollars.
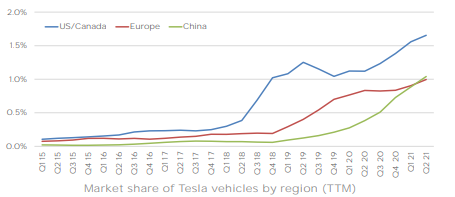
Figure 1: Tesla’s market share in various regions. Source: Tesla Q2/2021 earnings report
In China, after Tesla introduced a cheaper version of lithium iron phosphate for the Model Y, it is expected that the company’s cars will still have a certain market share in the local market. At present, Tesla’s market share in China is more than 1%, slightly higher than Europe, but lower than the main market – the United States/Canada (more than 1.5%). Regarding future growth prospects, Tesla pointed out in the report that “despite the continued semiconductor challenges, global demand is still strong … we can further increase production” and “expect to achieve an average annual growth of 50% in vehicle delivery in the coming years.”
In addition, boosted by sales growth and cost reduction, Tesla’s overall operating profit also recorded an increase. The report shows: GAAP operating profit was 13.12 billion dollars; GAAP net income achieved an eighth consecutive quarter of profit at US $1.142 billion, an increase of 998%. Not only that, Tesla’s GAAP car gross profit margin was 28.4% (25.8% after deducting points income). In addition, earnings per share (EPS) also exceeded consensus expectations and recorded US $1.45, an increase of more than 55% from the previous quarter, and an increase of nearly 230% year-on-year.
On the other hand, Tesla recorded a $23 million Bitcoin impairment in the second quarter, which was mainly related to the earlier collapse of the asset’s price. At present, the value of net crypto assets held by Tesla is $1.311 billion. Taking into account the cost price of a single currency held by Tesla, previous reports pointed out that Bitcoin falling below $30,000 is equivalent to falling below Tesla’s cost line, and ultimately causing Tesla to face a huge loss. In any case, as the encrypted asset has fallen out of dangerous levels, investor concerns have eased.
In addition to the current global supply chain challenges, other factors that may hinder the company’s growth include limited battery supply and the delay of the Semi truck project (expected to start in 2022). However, given that Tesla has a solid foundation and ability to deliver more cars, investor sentiment remains optimistic overall.
Technical analysis:
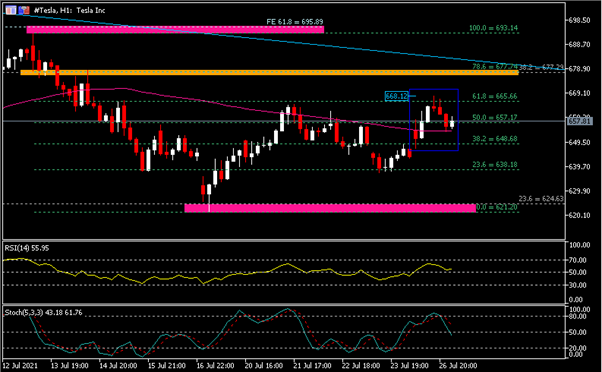
The 1-hour chart shows that the trend of #Tesla yesterday was first up and then down. The company’s share price recorded a peak of $668.12, then pulled back and closed above 100-period SMA, and at the same level was the 50.0% Fib. retracement level extending from the peak on July 13 this year to the low on July 19, or $657.20.
The near-term resistance is 665.70 (H1 61.8% Fib. retracement level) to the $668.12 area. If the breakout is successful, the stock price is expected to continue the upward trend and test the next resistance area, from $677.30 to $677.7. However, if the bulls have weak momentum, then a drop below $657.20 and 100-period SMA suggests that the stock will face downside risks. Short-term support includes $648.70 (H1 38.2% Fib.retracement level) and $638.20 (H1 23.6% Fib. retracement level) and the low point seen on July 19 from $621.20 to $624.65 (D1 23.6% Fib. retracement level) area.
From the perspective of technical indicators, the indications as per the RSI and Stochastics are deviating. The former remained above the 50.0 level, while the latter formed a deadlock in the overbought area, and the fast line is currently testing the 50.00 level.
Click here to access our Economic Calendar
Larince Zhang
Regional Market Analyst
Disclaimer: This material is provided as a general marketing communication for information purposes only and does not constitute an independent investment research. Nothing in this communication contains, or should be considered as containing, an investment advice or an investment recommendation or a solicitation for the purpose of buying or selling of any financial instrument. All information provided is gathered from reputable sources and any information containing an indication of past performance is not a guarantee or reliable indicator of future performance. Users acknowledge that any investment in Leveraged Products is characterized by a certain degree of uncertainty and that any investment of this nature involves a high level of risk for which the users are solely responsible and liable. We assume no liability for any loss arising from any investment made based on the information provided in this communication. This communication must not be reproduced or further distributed without our prior written permission.


