Procter & Gamble’s fiscal quarter earnings report is due on October 19, 2021. The multi-national corporation reported $76.1 billion in net revenues for 2021, a 7% increase over the previous year. Organic revenues grew 6%, driven by a 3% rise in organic volume, excluding the effects of foreign exchange, acquisitions and divestitures.
Due to a 4% rise in net earnings and a reduction in shares outstanding, diluted net earnings per share for the quarter were $1.13, up 6% from the prior year’s reported EPS. The rise in net earnings was largely due to higher net sales, which were offset by lower operating margins [1].
As customers prepare to return to the office and social events, P&G recorded the highest increase in its beauty and healthcare divisions. Organic sales increased by 14% in the health industry. Oral care items, such as Oral B toothbrushes, accounted for a large portion of that rise.P&G’s beauty division had a 6% increase in organic sales. The company’s premium SK-II brand was in high demand. However, according to the company, reduced selling volumes in North America due to inventory difficulties negated some of the increases [1].
The fabric and home-care categories, including Dawn and Cascade dish detergents, had a 2% increase in organic sales. However, consumers are buying fewer cleaning goods for their homes. Thus, growth in this category has slowed. Organic sales increase of 6% was seen in the company’s grooming division, which comprises Gillette and Venus. The only sector with falling organic sales was baby, feminine, and family care, which had a 1% decline from a year ago.
P&G forecasts all-in revenue growth of 2 to 4% in the fiscal year 2022 compared to the previous fiscal year. All-in sales growth is projected to be flat to slightly positive due to foreign exchange. According to the company, organic revenue growth is expected to be in the region of two to 4% [1].
P&G forecasts a diluted net profits per share increase of six to 9% in fiscal 2022, compared to $5.50 in fiscal 2021. Compared to fiscal 2021 core EPS of $5.66, core earnings per share growth for fiscal 2022 is projected to be in the region of three to 6%. According to the company’s current expectation, increasing commodity and freight prices would cause headwinds of about $1.9 billion after-tax, which will be offset by foreign exchange gains of around $100 million after-tax.
The effect of commodities, freight and foreign exchange on the fiscal year 2022 EPS is about $0.70 per share, or a 12% point headwind to EPS growth [2].
PG Stock Analysis
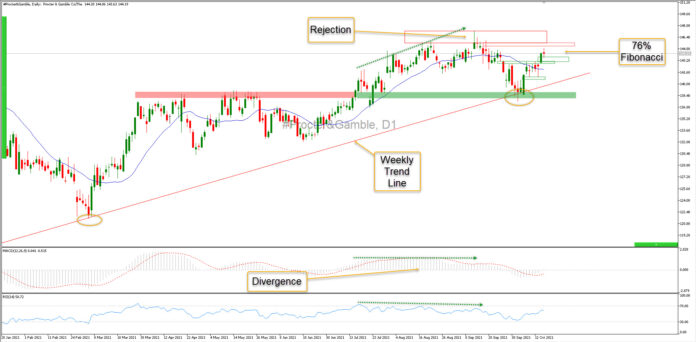
After reaching its high on September 13, PG’s stock went into decline. The stock reached a high of 147 and then dipped to 137, the level it saw in July. However, it made some recovery afterward, and at the time of writing, it is trading at 144.
On the daily chart, the price is above the 100-day MA, and the MACD is pointing upwards. This suggests a bullish trend. The next resistance for the stock lies around 147, its previous high. If the price can break this barrier, it can go towards the next resistance of 150. On the other hand, the stock’s support lies around 137. If the price breaches this level, it can further dip towards the 132 level. [3]
- https://www.pginvestor.com/financial-reporting/press-releases/news-details/2021/PG-Announces-Fourth-Quarter-and-Fiscal-Year-2021-Results/default.aspx
- https://finance.yahoo.com/news/procter-gamble-pg-q4-earnings-121512760.html
- https://finance.yahoo.com/quote/PG/
Click here to access our Economic Calendar
Adnan Rehman
Market Analyst
Disclaimer: This material is provided as a general marketing communication for information purposes only and does not constitute an independent investment research. Nothing in this communication contains, or should be considered as containing, an investment advice or an investment recommendation or a solicitation for the purpose of buying or selling of any financial instrument. All information provided is gathered from reputable sources and any information containing an indication of past performance is not a guarantee or reliable indicator of future performance. Users acknowledge that any investment in Leveraged Products is characterized by a certain degree of uncertainty and that any investment of this nature involves a high level of risk for which the users are solely responsible and liable. We assume no liability for any loss arising from any investment made based on the information provided in this communication. This communication must not be reproduced or further distributed without our prior written permission.


