


The US Dollar rose to a peak of 114.69 against the Yen for the first time since November 2017, with the benchmark 10-year Treasury yield touching a fresh 5-month high of 1.68%. Higher long-term US yields increase the allure of the asset to Japanese investors. However, the two-year Treasury yield was up around 0.41% after retreating sharply overnight from Monday’s 19-month high of 0.45%.
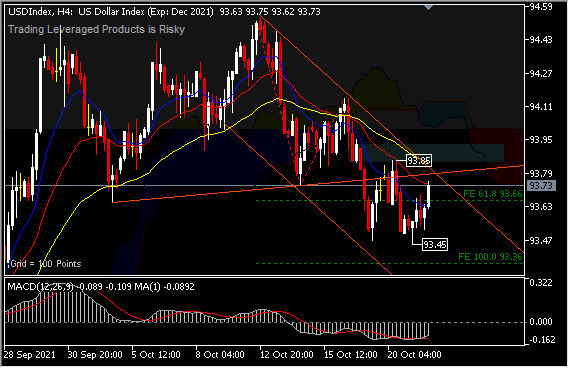 The USDIndex, which measures the Greenback against major currencies, including the Yen, was little changed at 93.73 after forming a double bottom at a low of 93.45 this month, gaining 0.17% below the minor resistance of 93.85. The outlook for the US economy is mixed, after data showed that US housing construction unexpectedly fell in September and permits fell to a one-year low amid acute shortages of raw materials and labor, supporting expectations that economic growth slowed sharply in the third quarter. However, existing home sales in September rose +7.0% m/m to an 8-month high of 6.29 million, stronger than expectations of 6.10 million. On the upside, US weekly initial jobless claims unexpectedly fell -6,000 to a 19-month low of 290,000, suggesting a stronger-than-expected labor market for an increase to 297,000.
The Yen strengthened on Thursday amid increasing safe-haven demand, after the JPN225 fell -1.67%. The Yen also found support on Thursday amid a report from Kyodo News that said Tokyo would lift its pandemic restrictions starting this Monday.
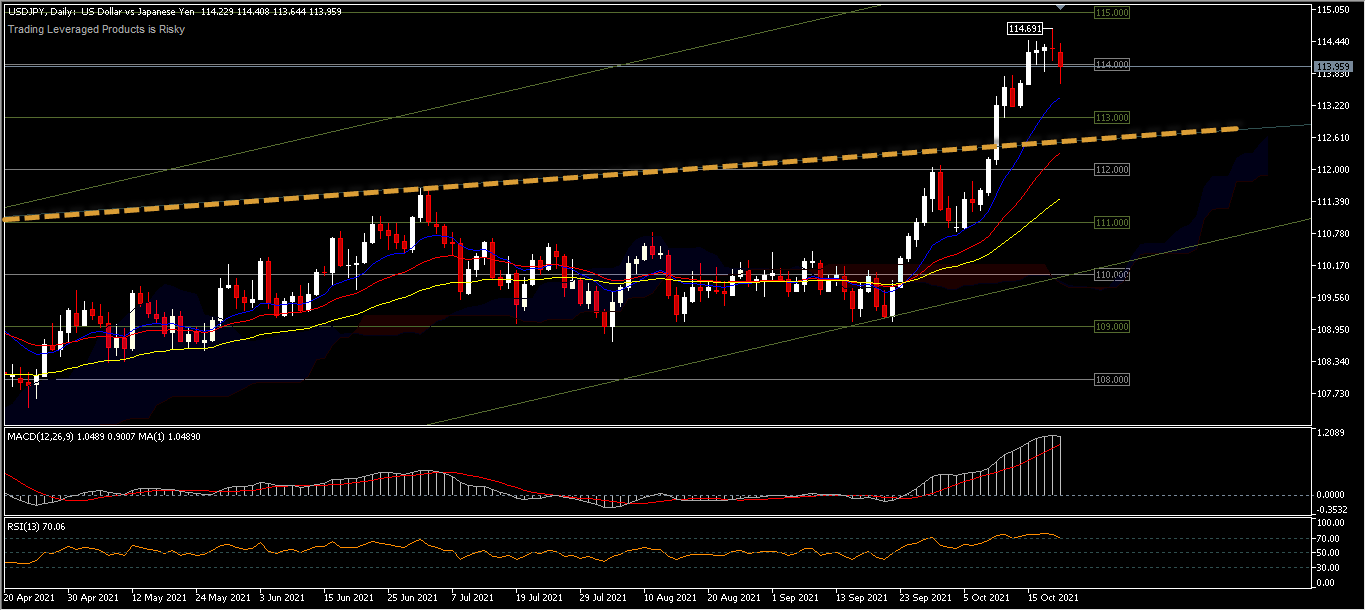
USDJPY is starting to look exhausted at the annual resistance area, below the 115.00 price level with the appearance of a daily doji candle pattern above 114.00. The RSI validates the rally momentum that is starting to fade at overbought levels, while the MACD takes more than one day of trading to validate a bearish signal. Overall, the uptrend has not shown any change, but the signs are already starting to be felt with the presence of 3 northern star candles. The pair is trading down 0.25% slightly below 114.00 at press time. A move to the downside will target 113.18 and a break of this level, the correction will target 112.05. On the upside, the price still has the potential to test the minor resistance at 114.20; 114.40 and recent peaks. Overall prices still look neutral towards the weekend.
Click here to access our Economic Calendar
Ady Phangestu – Market Analyst – HF Educational Office – Indonesia
Disclaimer: This material is provided as a general marketing communication for information purposes only and does not constitute an independent investment research. Nothing in this communication contains, or should be considered as containing, an investment advice or an investment recommendation or a solicitation for the purpose of buying or selling of any financial instrument. All information provided is gathered from reputable sources and any information containing an indication of past performance is not a guarantee or reliable indicator of future performance. Users acknowledge that any investment in Leveraged Products is characterized by a certain degree of uncertainty and that any investment of this nature involves a high level of risk for which the users are solely responsible and liable. We assume no liability for any loss arising from any investment made based on the information provided in this communication. This communication must not be reproduced or further distributed without our prior written permission.


