While most traders are focused on the weakness of major currencies such as the Euro, Pound Sterling and the Yen against the US Dollar in 2021, the Canada Dollar is the only G8 currency that remains strong against the US Dollar. The combination of the positive post-Covid-19 domestic economic recovery in Canada and the rise in commodity prices to the highest level since 2015 helped strengthen the CAD as a whole.
The Bank of Canada (BoC) became the first major central bank to reduce the quantity of QE last April from C$4 billion to C$3 billion, followed by a second reduction in July to C $2 billion. Canada’s current economic situation is now in good shape with the unemployment rate having dropped to 6.9% in September followed by 157,000 new jobs for the same month. Inflation is currently at a high of 4.4% (CPI y/y) up from 4.1%, which is much higher than the BoC’s 2.0% projection but the BoC has stressed that this high state of inflation is temporary in nature and will decline again in the near future. Canada’s Gross Domestic Product (GDP) also performed well for 2021 despite a slight decline of -0.3% in the 2nd quarter report, but the outlook for the 3rd quarter is expected to be positive after the monthly GDP (MoM) report for August reported growth of 0.7%. The GDP projection for 2021 is now set at 6%.
Intermarket factors also influenced the strengthening of CAD where WTI Oil (US Oil) has consolidated and recorded the highest price since 2014. The increase in post-Covid-19 demand and production controls by oil producers finally managed to balance the demand and supply in this commodity. USOil’s current price is above $ 81 and oil prices are expected to strengthen again in the near future.
As a result, analysts now expect the BoC to once again cut its QE allocation to C $1 billion at its policy meeting on October 27, 2021. Investors will see the BoC’s projections and tone at next week’s policy meeting on the same date the BoC will raise interest rates. ING reported that it is likely that QE will be terminated by the BoC this December.
USDCAD
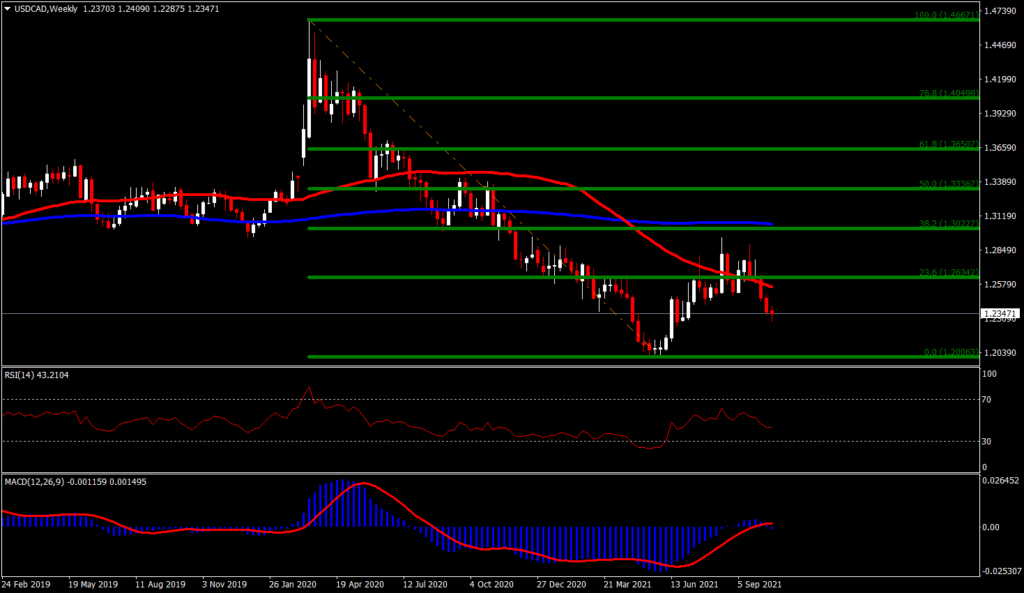
USDCAD was relatively volatile in 2021 where it recorded its lowest price since 2015 at 1.2006 before soaring back to 1.2948 and is now back declining and trading below 1.2400. USDCAD has been showing a downward trend since Q2 2021. The latest trading price is around 1.2350. USDCAD’s weekly chart shows USDCAD failed to hold on to the 23.6% Fibonacci retracement and also failed to break the 50-week SMA. The RSI-14 data still shows a declining momentum with a reading at 43. While the MACD indicator shows a horizontal momentum with the signal line still slightly above the 0 level, a new bottom histogram is starting to form.
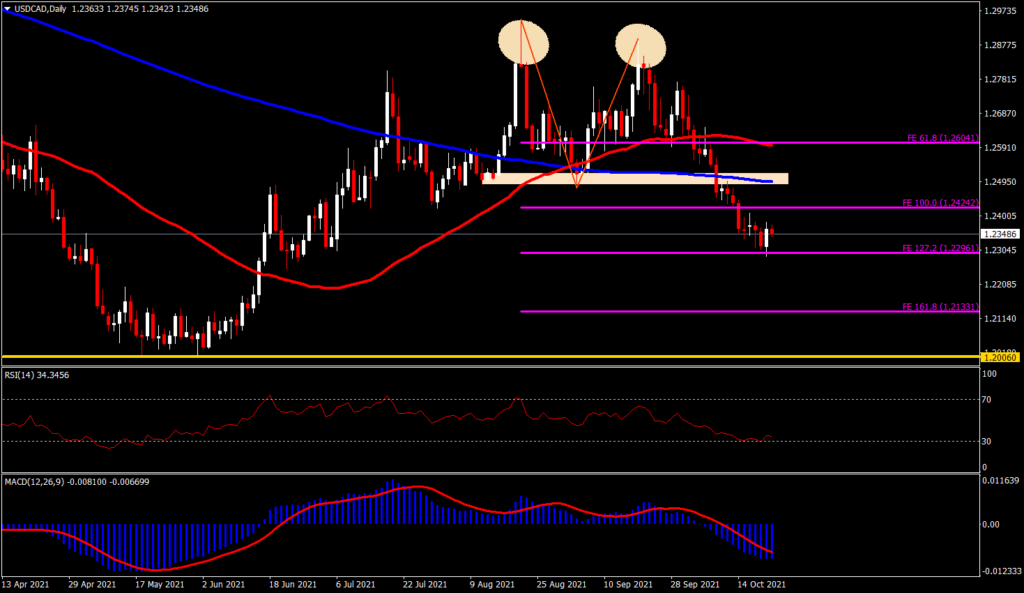
In the daily chart, USDCAD formed 2 tops within August and September and moved sharply downwards afterwards. The Fibonacci extension indicates that the FE 127.2 target has been reached and that level is the nearest support level for now at 1.2296. Breaking this important support level will activate the FE161.8 target at 1.2133. On the other hand, the 200-day MA level as well as the double top neckline level is near 1.2500 the closest resistance to Bull testing. The RSI-14 has risen slightly after touching the oversold level of 30 a few days ago and is now at a reading of 34. It indicates that bearish momentum is still dominating the market. The MACD signal line is well below and the MACD histogram has shown it has reached a minimum, giving the possibility that a retracement will take place in the near future.
Click here to access our Economic Calendar
Tunku Ishak Al-Irsyad
Market Analyst
Disclaimer: This material is provided as a general marketing communication for information purposes only and does not constitute an independent investment research. Nothing in this communication contains, or should be considered as containing, an investment advice or an investment recommendation or a solicitation for the purpose of buying or selling of any financial instrument. All information provided is gathered from reputable sources and any information containing an indication of past performance is not a guarantee or reliable indicator of future performance. Users acknowledge that any investment in Leveraged Products is characterized by a certain degree of uncertainty and that any investment of this nature involves a high level of risk for which the users are solely responsible and liable. We assume no liability for any loss arising from any investment made based on the information provided in this communication. This communication must not be reproduced or further distributed without our prior written permission.


