


International retail giant Walmart , the US company that runs the department store chain, is again scheduled to report third-quarter fiscal results on Tuesday, 16 November before the market opens. As of November 2021 Walmart has a market cap of $412.02 billion, making it the 18th most valuable company in the world by market capitalization. What is meant by market capitalization is the total market value of the outstanding shares of a public company and is usually used to measure the company’s value. While other retailers have been hurt by closed stores and a weakened economy during the pandemic, Walmart has benefited from selling essentials like food and having strong online operations.
In its second-quarter report, Walmart has benefited from increased demand for essential goods amid higher household consumption caused by the pandemic. The rising stay-at-home trend is also driving an increase in e-commerce sales. Walmart’s e-commerce business and omnichannel penetration have grown even more amid the social distancing caused by the pandemic. In the Q2’2021 report company’s total revenue was $141.0 billion, up 2.4%, negatively affected by approximately $8.9 billion divestment-related. Walmart’s corporate sales grew 5.2%. GAAP EPS Q2 FY22 $1.52; Adjusted EPS $2.5 from $1.78. Source of revenue is e-commerce sales +6% (103% in two years). Sam’s Club corporate sales increased +7.7%, membership revenue +12.2% with member numbers hitting all-time high, consolidated operating income +21.4%, with company-wide strength.
For the third quarter report, it is expected the company’s stock to trade higher on possible growth-driven earnings gains across all reporting segments: Walmart US, Walmart International and Sam’s Club.
- Based on 24 analysts, Tipranks gave the company a “buy strong” rating with a projected reach of $171.46 or 16.04% of its current price.
- The Zacks consensus forecast for revenue was pegged at $135.3 billion, representing a 0.4% increase from the figure reported in the year-earlier quarter. For earnings of $1.39 per share, which represents a 3.7% increase from the figure reported in the previous year period. Rating #3 (HOLD) and +1.97% Earnings ESP.
-
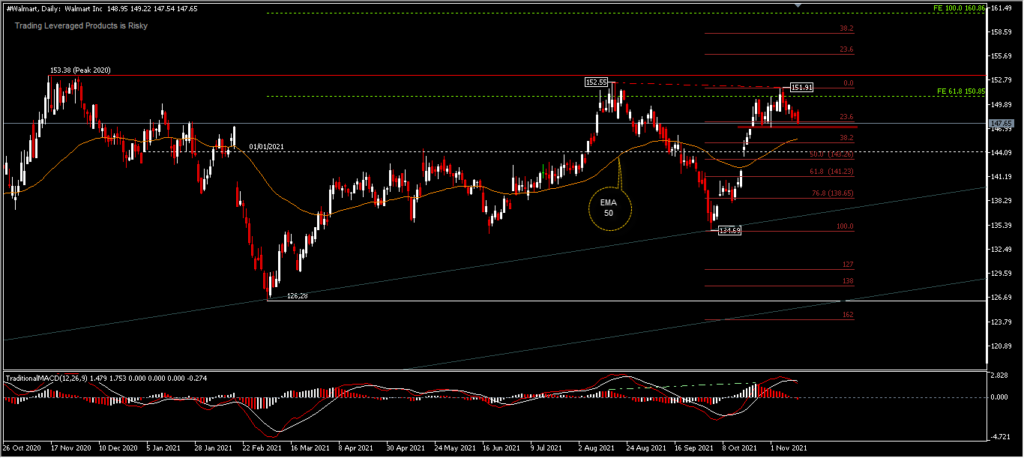
#Walmart, D1

Technically, #Walmart‘s share price experienced a strong growth in October of +7.2% and in November tended to be flat with a decline of -1.01%. The asset price has recorded a historic peak in November 2020, exactly a year ago at the price of 153.38 . Although, after the correction reached a low of 126.28 last March, the asset price continued to climb by recording 2 new peaks at a lower price at 152.55 in August and the last one at 151.91 in this month. Asset prices seem to have temporarily lost their rally momentum in the past 2 weeks, ahead of the Q3 2021 earnings report. This can be seen from the divergence bias from the 2nd and 3rd peaks. The crossing of the MACD signal line signals a possible correction in the asset price, with the immediate target of the decline at the 38.2% retracement level around 145.33 or near the 50-day EMA, with a continued move to the 50.0% retracement level (143.26), of course after breaking the minor support at 147.19 . The decline in asset prices likely tends to be due to the pull action, to get the asset price cheaper to buy.
On the positive side, as long as the asset holds above its January 2021 opening price ( 144.19) we may still witness November and December price growth due to Christmas and New Year holiday spending. A price move above 153.38 peaks would confirm a continued 134.59 rebound with price projections around 160.88 (from 126.28-152.55 and 134.69 FE drawdowns). As long as the top resistance at 153.38 holds, the possibility of consolidation and correction will take effect for a while.
Overall, asset prices are still on a bullish path, despite the risk of supply bottlenecks and rising inflation, but demand remains essentially high. Stocks may move higher, if these key figures beat expectations in the earnings report. On the other hand, if it misses, it is likely to move lower.
Click here to access our Economic Calendar
Ady Phangestu
Market Analyst
Disclaimer: This material is provided as a general marketing communication for information purposes only and does not constitute an independent investment research. Nothing in this communication contains, or should be considered as containing, an investment advice or an investment recommendation or a solicitation for the purpose of buying or selling of any financial instrument. All information provided is gathered from reputable sources and any information containing an indication of past performance is not a guarantee or reliable indicator of future performance. Users acknowledge that any investment in Leveraged Products is characterized by a certain degree of uncertainty and that any investment of this nature involves a high level of risk for which the users are solely responsible and liable. We assume no liability for any loss arising from any investment made based on the information provided in this communication. This communication must not be reproduced or further distributed without our prior written permission.


