


Alibaba Group Holding Limited, an e-commerce giant based in China, is a leading example of China’s technological capabilities. Although the government cannot permanently damage their business, some investors seem to have begun to doubt Alibaba’s future as its fight against Chinese government regulations led to ’’#Alibaba’s stock price underperforming.
Throughout the recent stock market sell-off, e-commerce stocks have been hit particularly hard. Delivery delays, labor shortages and cooling investor sentiment after the holiday season have contributed to a tighter corporate valuation. 5 quarters have passed and the #Alibaba stock price has not shown any signs of revival, although many analysts expect a bullish trend to be imminent, due to the underlying fundamentals and attractive discount prices. Alibaba’s share price has fallen more than 61% over the past year from a peak of 319.27 and it’s not clear yet whether it has found its low point to bounce back from.
Alibaba Group Holding Limited is expected to report its Q3 2021 earnings on Tuesday, 08 February 2022 based on the previous year’s report date. According to Zacks Investment Research, the consensus EPS forecast for the quarter is $2.41 reflecting an annualized decline of 28.7%. The reported EPS for the same quarter last year was $2.98. For their most recent quarter, Alibaba reported earnings of $1.74 per share, missing the Zacks Consensus forecast of $1.87 per share. This reflected a negative earnings surprise of 6.95%. Alibaba Group last posted its earnings results on Nov. 18, 2021, when it announced that it earned 200.69 billion yuan ($31.4 billion) vs. forecasts of 204.93 billion yuan, up 29% y/y. Zacks gives a rating of 5 (strong sell) for Alibaba’s stock price.
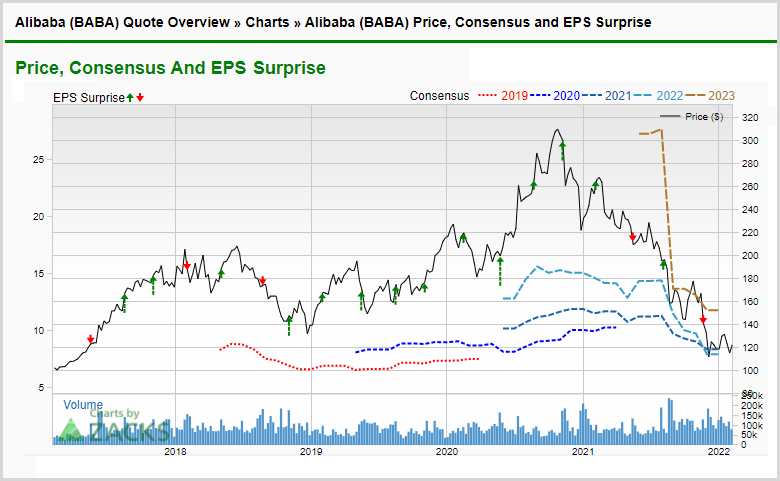
In contrast to Zacks, Tipranks has a consensus Strong Buy analyst rating, based on 23 analysts who offered 12-month price targets for Alibaba in the last 3 months. The average price target is $188.79 with an estimated high of $250.00 and an estimated low of $140.00. The average price target represents a 54.47% change from the last price of $122.22.
Alibaba’s e-commerce segment is very website-centric, and the traffic from users to the company’s website may give some indication of current consumer trends. In the currently unreported period, total estimated visits are up 23.41%, a very bullish metric.
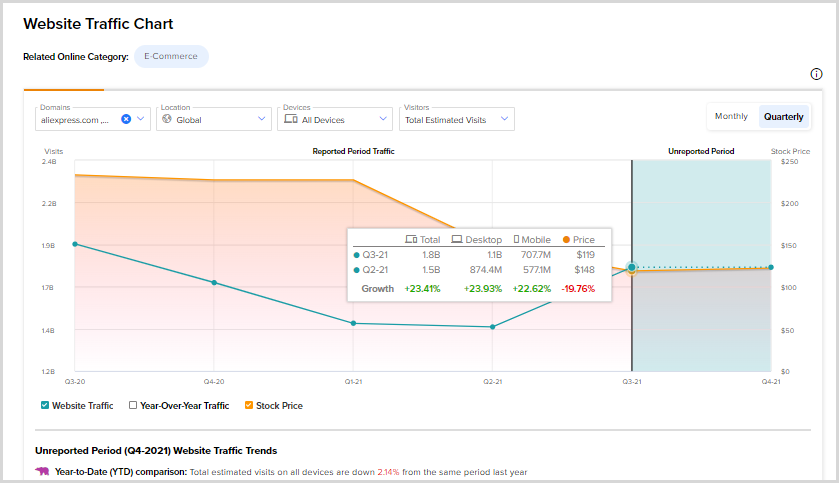
Alibaba’s e_commerce segment is very website-centric, perhaps the traffic from users to the company’s website can give some indication of current consumer trends. In the currently unreported period, total estimated visits are up 23.41%, a very bullish metric.
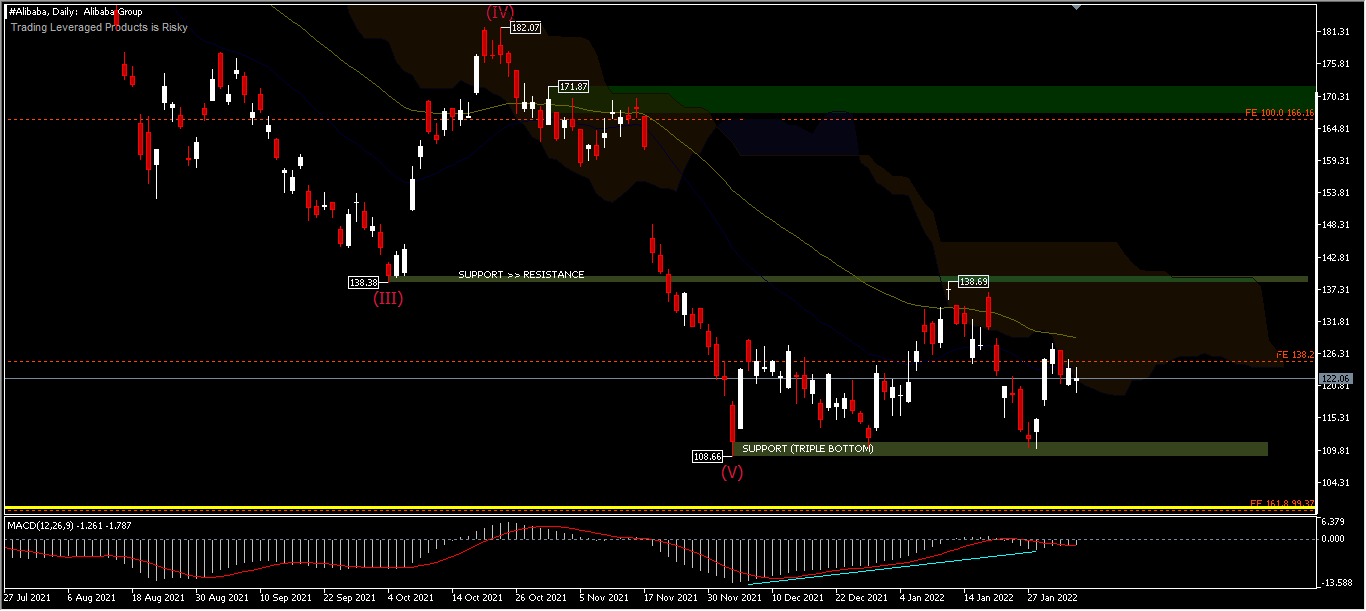
#Alibaba, D1 –
The Chinese tech giant was on a roller coaster throughout 2021 after the Chinese government initiated a series of industry-wide crackdowns in April. The asset’s price closed at $119.85 by the end of the year. The massive loss in revenue and DiDi’s takedown were two other key events that stumbled the online retail giant recently. Alibaba had one of its worst days after its November earnings report, with an intraday drop of over 10%.
Charlie Munger, 50-year partner of Warren Buffet, doubled his stake in Alibaba the first time in Q3 2021 and doubled it again in Q4. The move seems to be a fine example of a famous quote from the half-century investment legend: “when a large company has a temporary problem, we want to buy it while they are on the operating table.”
Based on the daily chart, the stock price is leaning towards the descending trajectory formed since early 2021. Current support can be found at the $108.66 (triple bottom) level from September 2016 and the daily divergence suggests a hopeful recovery, if current earnings reports are above estimates. However, a break of this structural level with a disappointing earnings report will send the price to the psychological $100.00 level (yellow line). On the other hand, the 52-day moving average around $130.00 will be an important resistance for the price to head for, if the asset is to challenge this year’s high of $138.69 as resistance.
Click here to access our Economic Calendar
Ady Phangestu
Market Analyst
Disclaimer: This material is provided as a general marketing communication for information purposes only and does not constitute an independent investment research. Nothing in this communication contains, or should be considered as containing, an investment advice or an investment recommendation or a solicitation for the purpose of buying or selling of any financial instrument. All information provided is gathered from reputable sources and any information containing an indication of past performance is not a guarantee or reliable indicator of future performance. Users acknowledge that any investment in Leveraged Products is characterized by a certain degree of uncertainty and that any investment of this nature involves a high level of risk for which the users are solely responsible and liable. We assume no liability for any loss arising from any investment made based on the information provided in this communication. This communication must not be reproduced or further


