


Last Thursday, the S&P500 closed out its worst first-half since 1970, with losses more than -20%. On Friday ahead of the long US holiday weekend, the index managed to gain its support and closed above +2% at 3827. On the other hand, recession fears and disappointing economic data have lifted demand for the treasuries, with 10-year treasury yield fell to lowest level since May.

Fig. 1: Best S&P 500 Stocks in First-Half of 2022. Source: Bankrate.
Despite the macroeconomic factors, there are some stocks continued to deliver outstanding results. According to Bankrate, an independent, advertising-supported publisher and comparison service, Occidental Petroleum topped the S&P 500 stocks, with YTD performance over 100%.
Occidental Petroleum is an American oil and gas conglomerate founded since 1920 which operates through three segments: Oil and Gas, Chemical, Midstream and Marketing. Benefited by higher oil prices and the company’s solid fundamentals, Occidental Petroleum in general delivering satisfying results in 2021, with reported sales hit 26.0B, exceeded consensus estimates at 25.4B. Also, Earnings per share (EPS) rose to $2.55, the highest since 2018 ($5.01) [Source: CNN Business].
“For the full year, Wall Street expects Occidental to post US$37 billion in revenue, up 42% from the US$26 billion reported in 2021”. – Matt Miczulski
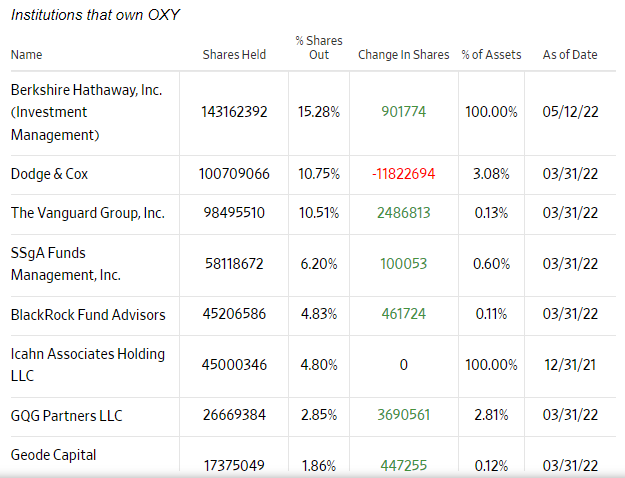
Fig. 2: Institutions and their % Shares Held in Occidental Petroleum. Source: The Wall Street Journal.
Another reason for Occidental Petroleum to outperform its competitors is that the company has always been the “Oracle of Omaha” – Warren Buffet’s favourite. Latest news reported that Buffett’s company, Berkshire Hathaway continued to buy 9.9 million more Occidental shares, now totaled 163.4 millions shares worth about $9.9B. As a result, Berkshire Hathaway now holds 17.4% stake in the oil company. Its aggressive move has sparked speculation that Berkshire might eventually buy Occidental, once the latter’s credit turns to an investment-grade.
Technical Analysis:

The Daily chart displayed #OccidentalPetr remains supported above the lows seen in 2018 ($56.74). The company’s stock price closed bearish in June following market over-reaction and uncertainties. In general, it remains above 100-day SMA but far below the median estimate of analysts at $75. Nearest resistance lies at $62.70. A successful breakout may indicate possibility for the bulls to extend its gains towards $68.20, $74 and $76.80. On the other hand, the lows seen in 2018 ($56.74, lies near to 100-day SMA) serves as the nearest support. A close below the level may indicate more technical correction into testing support zone $54.30-$55.70, followed by the psychological level at $50.
Click here to access our Economic Calendar
Larince Zhang
Market Analyst
Disclaimer: This material is provided as a general marketing communication for information purposes only and does not constitute an independent investment research. Nothing in this communication contains, or should be considered as containing, an investment advice or an investment recommendation or a solicitation for the purpose of buying or selling of any financial instrument. All information provided is gathered from reputable sources and any information containing an indication of past performance is not a guarantee or reliable indicator of future performance. Users acknowledge that any investment in Leveraged Products is characterized by a certain degree of uncertainty and that any investment of this nature involves a high level of risk for which the users are solely responsible and liable. We assume no liability for any loss arising from any investment made based on the information provided in this communication. This communication must not be reproduced or further distributed without our prior written permission.


