


JPN225 and USDJPY, H4 and Daily
US equities extended their rout ahead of the close with major indices down 2.3-4.0%, but the Nasdaq suffered the most, free-falling 4.1%, or 316 points, to 7,422. To recap, high yields, the China trade war, Fed tightening fears, tech wobble, etc. have conspired to relieve investors of some of their complacency. Leveraged, macro- and real-money fund liquidation would not surprise amid this rebalancing, not to mention flight from the hotter fast-money algo/system traders.
Added to the mix late was news that the US Justice Department charged a Chinese intelligence officer, Yanjun Xu, of economic espionage for theft of trade secrets from leading US aerospace companies. This news is hardly likely to tamp down rising Sino-US trade/tariff animosity.
Topix and JPN225 are down -3.75% and -4.19% respectively. This was the largest one-day decline since March 1. Rising yields and earnings reports that have started to reflect the impact of the trade war triggered the initial wave of selling, and with investors heading for safety bond yields are coming down. Global central banks may still sound optimistic on growth and remain on course for further tightening, but markets are taking cover as growth concerns spike amid geopolitical trade tensions.
JPN225
Despite the sharp sell off, the JPN225 managed to remain above the 22,154.00 hurdle, which is September’s low, but also remained on track with the upside trendline set since the March bottom by connecting the higher low daily fractals. Even though the aggressive sell off could signal that the negative momentum will continue, the fact is that it remains above the September hurdle, the 200-day EMA, but more interestingly that it is currently outside Bollinger Band pattern, indicating that in the near term it is likely to see correction to the upside. An opening outside the Bollinger Bands pattern could theoretically suggest a return back to the mean line or at least within the pattern area.
Daily technical indicators confirm more bearish bias for the index: the RSI dropped from 79 high to 36, with further steam to the downside, while the MACD is decreasing significantly below the signal line but still stands within the positive area. In the 4-hour chart, technical indicators present a mixed outlook. RSI moves within the oversold territory, but sloping positively after the rebound from 19 low, suggesting short term strength for the Index. MACD on the other hand slipped below signal line and below neutral zone, something that implies that negative momentum could increase further.
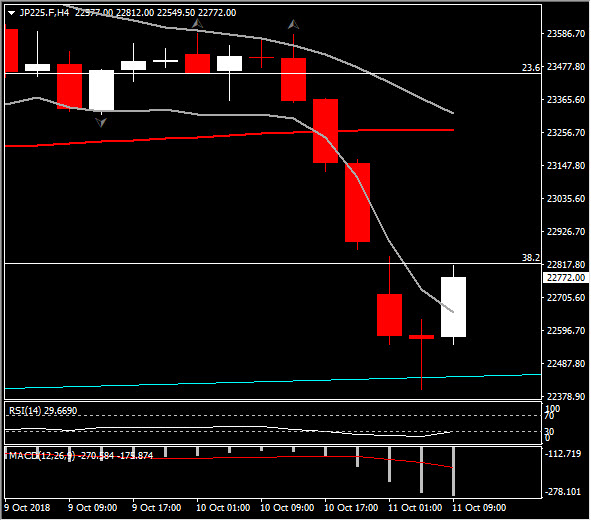
To recap, in the longterm JPN225’s outlook remains positive as prices hold above the trendline set since the March bottom, above the 200-day SMA but also above September’s low at 22154.00. Declines below this level will form a bearish rounding top pattern, which will mean that 50% Fib. level and 200-day EMA have been broken. The reach and the break of the latter could challenge the 21790.00 level, which coincides with 61.8% Fibonacci retracement level and August Support.
However, this overextended move could also be followed by a rebound. In such a scenario, only a significant close above 23000.00 would imply that bulls are back in the market. This could lead the asset back into the upside channel, with the next Resistance at 23.6% fib level, at 23450.00, which is also the mid of October’s decline.
Within the day meanwhile, a closing above the 22867.00 would fill the gap could suggest a retest of the PP level at 23140.00. Intraday immediate Support holds at 22395.00 and Resistance at 22847.00.
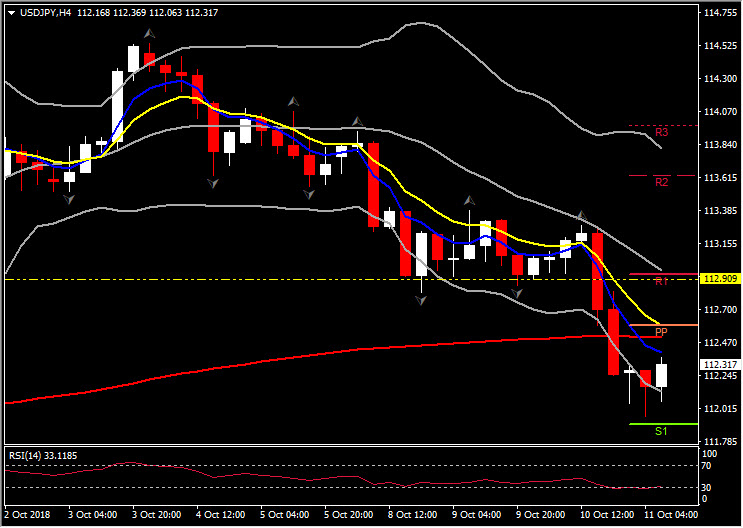
USDJPY
As it is widely known, Nikkei (JPN225) and Yen are negatively correlated, so as JPN225 the Yen outperforms. This is today’s theme as well, as USDJPY has posted a 3-week low at 111.97, while the Yen picked up safe haven demand. USDJPY formed 5 daily bearish candles, and it is currently moving within the lower Bollinger Band pattern, challenging the 50-day SMA Support level at 111.80.
Meanwhile technical indicators in the daily time frame, but intraday as well, strongly support that the negative outlook is likely to continue in the near future. In the 4-hour chart, MACD lines are extended lower, below trigger line and neutral zone. Intraday Support levels are set at 111.80 and 111.55, while Resistance is set at 112.60. If price turns up to Resistance, the confluence of 20-period SMA, R1 and FE61.8 level could offer the next Resistance level for the asset price, at 112.90.
Click here to access the HotForex Economic calendar.
Want to learn to trade and analyse the markets? Join our webinars and get analysis and trading ideas combined with better understanding on how markets work. Click HERE to register for FREE! The next webinar will start in:
[ujicountdown id=”Next Webinar” expire=”2018/10/11 15:00″ hide=”true” url=”” subscr=”” recurring=”” rectype=”second” repeats=””]
Andria Pichidi
Market Analyst
HotForex
Disclaimer: This material is provided as a general marketing communication for information purposes only and does not constitute an independent investment research. Nothing in this communication contains, or should be considered as containing, an investment advice or an investment recommendation or a solicitation for the purpose of buying or selling of any financial instrument. All information provided is gathered from reputable sources and any information containing an indication of past performance is not a guarantee or reliable indicator of future performance. Users acknowledge that any investment in FX and CFDs products is characterized by a certain degree of uncertainty and that any investment of this nature involves a high level of risk for which the users are solely responsible and liable. We assume no liability for any loss arising from any investment made based on the information provided in this communication. This communication must not be reproduced or further distributed without our prior written permission.


