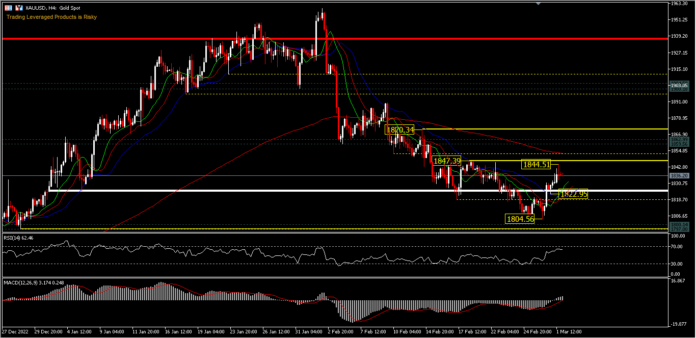
Gold prices rose, after strong Chinese economic data pressured the US Dollar and boosted speculation of better physical demand from China, but the risk of a US rate hike threatens gold’s outlook. XAUUSD rallied 0.53% to 1836.20 on Wednesday, after hitting a two-month low in the previous two days.
After rising nearly 3% in February, the dollar index moved 0.5% lower, making gold bullion cheaper for overseas buyers. Markets are cautiously optimistic for China’s economic recovery following strong data that has seen a dollar rally reverse that boosted gold and riskier assets temporarily. China’s manufacturing activity expanded at the fastest pace in more than a decade in February. Demand for physical gold in major hubs has increased this year as Covid-19 restrictions are eased.
Although traditionally considered an inflation hedge, higher interest rates to control consumer prices dimmed interest in gold. Gold recorded its worst month since June 2021 in February after a raft of US data showed a resilient economy and tight labor market, fueling concerns that the Fed will deliver more rate hikes to curb inflation. Market participants expect the Fed’s target rate to peak at 5.45% in September, from the current range of 4.50%-4.75%.
Gold had the worst month since the middle of 2021, but has managed to nudge higherthis week, as the US dollar index corrects. Treasuries have been outperforming versus Bunds today, and the dollar is down against most currencies, which has helped to stabilise demand for the precious metall. Bullion is currently at 1834, after seeing an early low of 1829.89.
XAUUSD’s rise on Wednesday’s trading was a continuation of the 1804.56 rebound. Spot price was seen attempting to test the weekly high of 1847.39 but only registered a high of 1844.51. Intraday bias looks neutral for the time being, with support on the downside at 1822.95 and 1804.56. While a move above 1847.39 could test 1870.34 resistance. RSI is at 62 and MACD is in the buy zone with the histogram thin above the centerline.
Click here to access our Economic Calendar
Ady Phangestu
Market Analyst – HF Educational Office – Indonesia
Disclaimer: This material is provided as a general marketing communication for information purposes only and does not constitute an independent investment research. Nothing in this communication contains, or should be considered as containing, an investment advice or an investment recommendation or a solicitation for the purpose of buying or selling of any financial instrument. All information provided is gathered from reputable sources and any information containing an indication of past performance is not a guarantee or reliable indicator of future performance. Users acknowledge that any investment in Leveraged Products is characterized by a certain degree of uncertainty and that any investment of this nature involves a high level of risk for which the users are solely responsible and liable. We assume no liability for any loss arising from any investment made based on the information provided in this communication. This communication must not be reproduced or further distributed without our prior written permission.


