


At the time of writing, we are just few hours away from the next release of the US Consumer Price Index, expected to remain anchored at a 5% YoY growth rate as it was last month.
Just under two months ago, traders were cautiously optimistic about the path of prices and, consequently, the future of monetary policy. Price growth had peaked in June 2022 (-9.1%) and has since ”almost halved”, led by energy. Other once-hot components such as used vehicles showed a consistent decline (-11.2% y/y in March), searches for ”Supply Chain Disruption” were down sharply among Google Trends (in fact the Global Container Freight Rate index is at its lowest since September 2020) and some Central Banks such as the RBA and BOC had stopped raising rates, the FED being the next suspect. The most aggressive forecasters had gone so far as to predict a cut of up to 100 basis points by the end of 2023.
Never mind that the less volatile and more meaningful CORE CPI continued to print 5.6% growth – a long way from the ‘close to 2%’ target -, never mind that the job market was still tight, never mind that even Powell was insisting that his work on rates was far from over. The Shelter component (which weighs 30% in the CPI basket) was also still growing at double-digit rates.

Then the MAR23 data was published and, although showing a very modest increase, suddenly the markets started to consider the option of a persistent phenomenon. At one point, some even started to recall previous episodes of high inflation, such as in the 1970s, when prices moderated at least twice before rising further.

Right now, there’s a lot of uncertainty among money managers and the FED’s rate cuts bets in 2023 have started to be trimmed. And this is something that is affecting the USD.
Checking the daily chart of the EURUSD we can easily see that the price has been trapped in a sideways consolidation action, trading mostly between 1.0940 and 1.1060 during the last month. The bullish trend is still holding, but the 1.11 area looks like strong resistance for now.
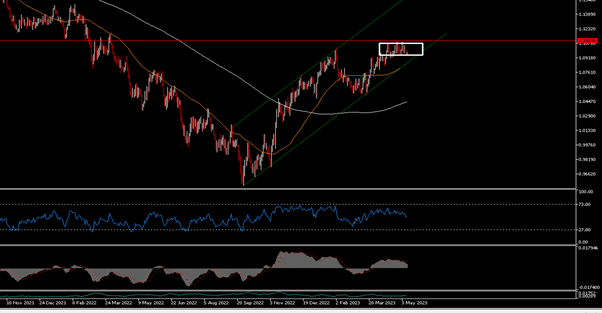
A softer or in-line figure could push EURUSD back into the rectangle (possibly up to 1.1060) and keep it trading sideways, while an upside surprise could make it break 1.0940.
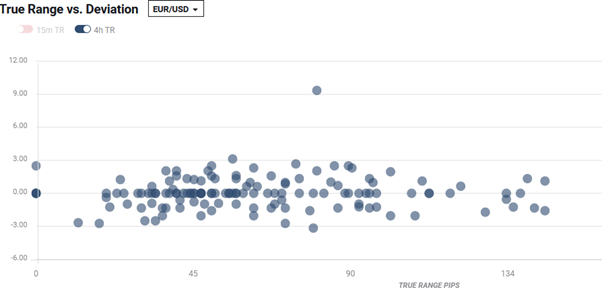
What is certain is that the data will most likely trigger some volatility, as can also be seen in this graph showing the pair’s usual Average True Range over the four hours following the data (the densest area is between 40 and 75 pips).
Click here to access our Economic Calendar
Marco Turatti
Market Analyst
Disclaimer: This material is provided as a general marketing communication for information purposes only and does not constitute an independent investment research. Nothing in this communication contains, or should be considered as containing, an investment advice or an investment recommendation or a solicitation for the purpose of buying or selling of any financial instrument. All information provided is gathered from reputable sources and any information containing an indication of past performance is not a guarantee or reliable indicator of future performance. Users acknowledge that any investment in Leveraged Products is characterized by a certain degree of uncertainty and that any investment of this nature involves a high level of risk for which the users are solely responsible and liable. We assume no liability for any loss arising from any investment made based on the information provided in this communication. This communication must not be reproduced or further distributed without our prior written permission.


