


Lately, we have become more than used to talking about inflation, interest rates, central banks. There is a lot of uncertainty about these topics, partly because most active investors have not experienced similar situations in their lives (such as the inflation shock of the 1970s).
This indecision could be clearly noticed in the long end of the fixed income curves where the 10y Bund is trading not far from last autumn’s levels and the 10y US Treasury has been in a tight range since at least March.
And such an indecisive behaviour is even more noticeable among currencies where the USD has not made much progress since the beginning of the year and has traded throughout the spring between 101 and 102.5, exactly where it was in January. When you think that there are so many other factors to consider in the price of a currency, like trade/budget balances, GDP growth, or the impact of a regional banking crisis or of the US debt ceiling, it’s not a bad idea to rely on price action analysis to clean up some of the noise from too many inputs.
The USD stopped weakening at the end of January/beginning of February after a decline in prices that took the index from 114.74 in September 2022 to the 100.50 / 101.00 area; and now it seems to be trying to raise its head again.
At first it was the strength against some Asian currencies such as the CNH or the JPY: in both cases, a trendline had already been broken in mid-April, bringing the Renminbi back close to 7.00, while the USDJPY retested the above-mentioned break before moving higher.
USDJPY, Daily
 Then, in the past few days, an emerging currency cross like USDZAR broke strongly off its 2022 highs and marked new ATH (also due to internal issues which we will examine in the future). Maybe all these pairs and crosses were canaries in the mine?
USDZAR, Daily

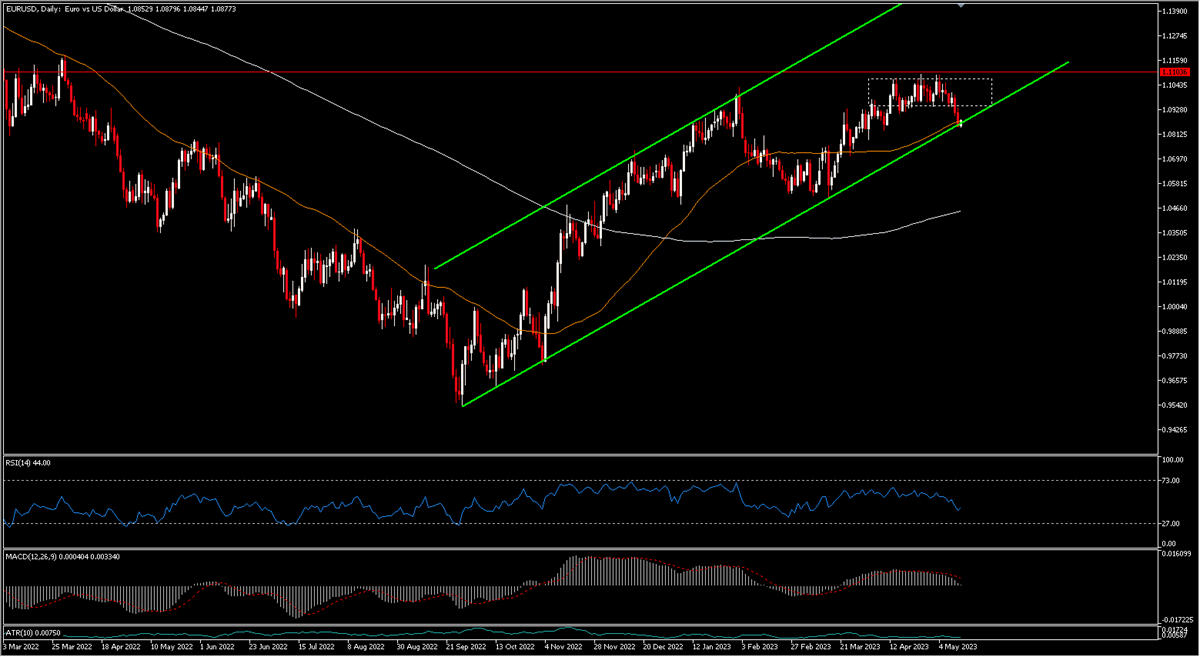
Obviously, a USD Index consistent movement could not happen without this also happening on the most important currencies that make up the basket of the USD index such as the Euro (which is worth about 60%) or the GBP. Well, in the last few days we are experiencing this kind of movements: the Cable fell 1.77% in 3 days after being rejected by a possible long term trendline in the 1.2675 area. EURUSD fell more than 1% between Thursday and Friday and is just now testing the bullish channel which originated in Oct2022.
EURUSD Daily
It goes without saying that these movements have been reflected in the USD Index which is just now testing the downtrend of the last 8 months. It is now the time to closely follow the greenback price action and find out if we are close to a trend change – or not.
USD Index, Daily

Click here to access our Economic Calendar
Marco Turatti
Market Analyst
Disclaimer: This material is provided as a general marketing communication for information purposes only and does not constitute an independent investment research. Nothing in this communication contains, or should be considered as containing, an investment advice or an investment recommendation or a solicitation for the purpose of buying or selling of any financial instrument. All information provided is gathered from reputable sources and any information containing an indication of past performance is not a guarantee or reliable indicator of future performance. Users acknowledge that any investment in Leveraged Products is characterized by a certain degree of uncertainty and that any investment of this nature involves a high level of risk for which the users are solely responsible and liable. We assume no liability for any loss arising from any investment made based on the information provided in this communication. This communication must not be reproduced or further distributed without our prior written permission.


