


The king of fixed income – one of them at least, the US 10-year T-Note future – currently finds itself in an interesting technical situation as well as showing a decent divergence against the US 2y and also against the German 10y (Bund) and the UK 10y (Gilt) futures.
Regarding the divergence against the short-end of the US curve, it is easy to understand this even without looking at any chart: the strong inversion – you have certainly heard about it – which reached -110 bps a few days ago (the 2y yields more despite having a shorter maturity) is witness to the fact that the 10y is under much less selling pressure (the price for bonds are inversely correlated to the yield). The 2y is sitting close to its lows, while the 10y is trading within a slightly ascendant channel.
Regarding the divergence against its European and UK peers, the fact that the performance of the US futures is comparatively better (Bund is not far from its recent lows and the Gilt also does not show any rising structure at all – although it is quite stable around 95) is testimony to the fact that the Fed is the bank that is more ahead of the curve, more realistically close to the peak of its restrictive cycle. It is a bit anomalous to link current monetary policy so much with a long-term rate (the greatest influence will be on short-term rates, obviously) but it still makes sense. That said, let’s look at the chart.
TECHNICAL ANALYSIS
US10YR.F Daily
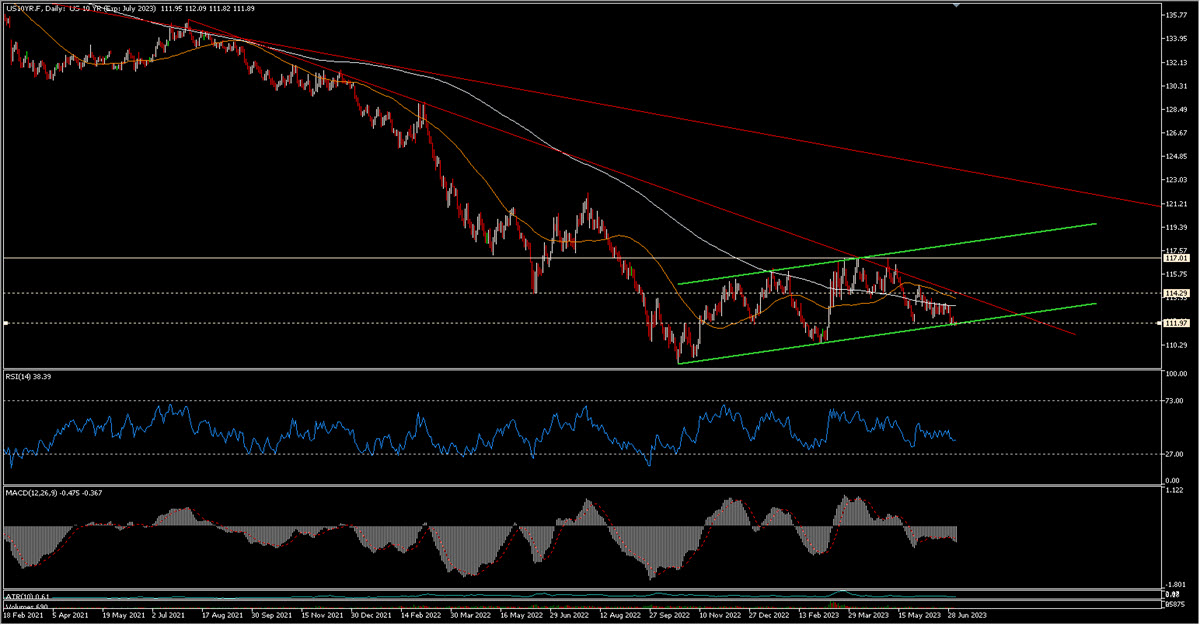
The rising channel is quite clear and the price is sitting just over it right now: this could allow any trader to easily establish their eventual exit strategy. On the very short term we need to monitor last Friday’s lows at 111.77 (and upwards 112.54 from which it was quickly rejected last Monday in a shortened session with very low volumes). Having said that, in the long term the nearby areas of 112 and 114.30 are the most relevant. The price is below its 50 and 200 MAs and they are flattening – in the case of the latter one – and even seems to be rising slightly – in the case of the former one. A further very important upward obstacle will be the descending trendline started in August 2021 which currently passes through the 114.30 area.
US10YR.F Daily, 09/2022 – Now 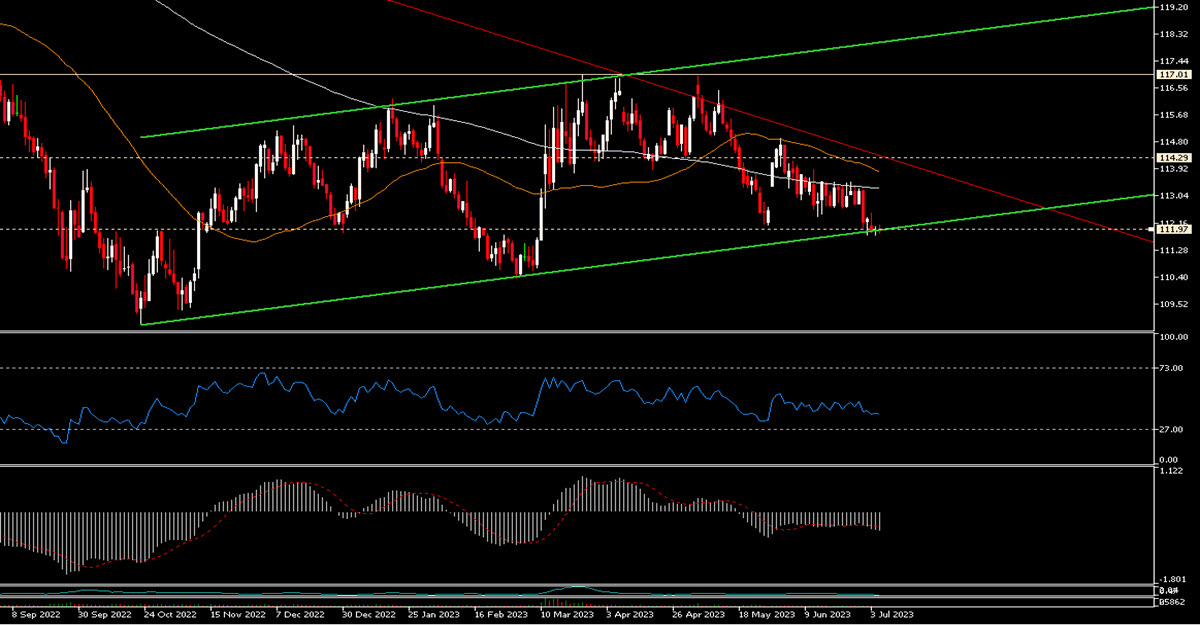
Long story short: it makes sense for the price of this instrument to remain compressed between the low side of the ascending channel and the downtrend line during the next days/weeks (if there is not an immediate break to the downside that is not our main scenario right now – difficult call!). A break in any direction will probably lead to an extension of the movement mid-term. Today’s FOMC minutes and Friday’s NFP are likely to cause some movement and could indicate a direction at least for this summer time. If – certainly not in the next few days – we see the US 10y trade above 114.30 this will be the signal of the proximity of a monetary shift in the US.
Click here to access our Economic Calendar
Marco Turatti
Market Analyst
Disclaimer: This material is provided as a general marketing communication for information purposes only and does not constitute an independent investment research. Nothing in this communication contains, or should be considered as containing, an investment advice or an investment recommendation or a solicitation for the purpose of buying or selling of any financial instrument. All information provided is gathered from reputable sources and any information containing an indication of past performance is not a guarantee or reliable indicator of future performance. Users acknowledge that any investment in Leveraged Products is characterized by a certain degree of uncertainty and that any investment of this nature involves a high level of risk for which the users are solely responsible and liable. We assume no liability for any loss arising from any investment made based on the information provided in this communication. This communication must not be reproduced or further distributed without our prior written permission.


