


Now that five stocks – Microsoft, Apple, Nvidia, Amazon and Tesla – have reached a combined 43.8% weight in the Nasdaq100 Index, a technical issue has arisen. Such a percentage is very close to being against a US Securities and Exchange Commission (SEC) rule on FUND diversification that says that a special rebalancing should be conducted any time the aggregate weight of companies, each having more than 4.5% weight in the index, tops 48%. The big Mega-caps rally has lifted the Nasdaq100 Index by 37.5% this year and considerably increased their weight within the same: at the present time Microsoft has the largest weight at 12.91%, followed by Apple at 12.47%, Nvidia at 7.04%, Amazon at 6.89% and Tesla at 4.50%, according to Refinitiv data. Thus, there will be a change in the composition of the technology benchmark with changes set to be announced tomorrow (July 14) and taking effect before the market opens on July 24. Such a rebalancing based on this SEC rule has happened twice before, despite Nasdaq revising the index weights every 6 months, in 2011 and 1998.
This, despite not having dramatic effects, will certainly lead to some changes: it will force investment funds that passively track the NDQ100 to adjust their portfolios and sell shares of companies that have their weight in the index reduced. There is a whole industry of funds that track indices, including the famous $200 billion Invesco QQQ ETF (which is available to trade with HFM) and they are expected to be impacted by the rebalancing. On the other hand, some smaller companies will see their weight rise, which according to Wells Fargo will include Starbucks, Mondelez, Booking Holdings, Gilead Sciences, Intuitive Surgical, Analog Devices and Automatic Data Processing.
Something like this is unlikely to happen with the SP500, where at the moment the top five firms make up for 22.2% of the index’s total market value: eventually we may begin to see a slightly lower correlation between these two indices.
QQQ Invesco ETF, Daily
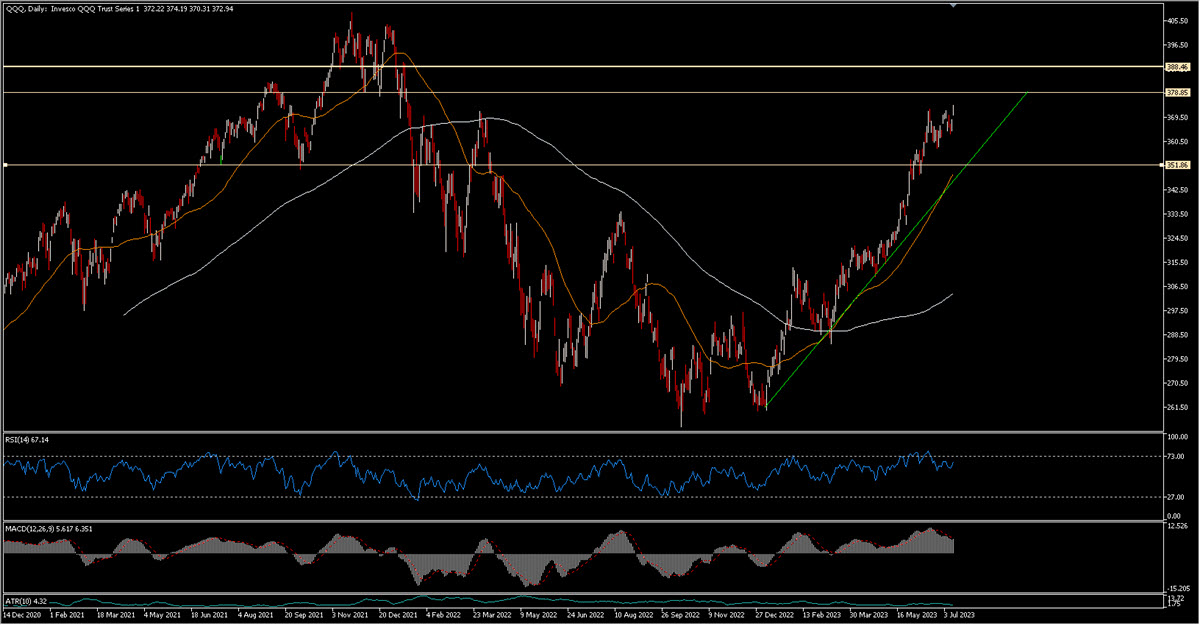
Above is the chart of the QQQ even though, as you can imagine, it is practically identical to that of the NDQ100. This is just one of the ETFs that you can trade with us and which will be presented in a webinar next week where you can find out about their sectorial differentiation possibilities. In any case, you can notice that the recent high at $372.8 has been broken and the next barriers – should this euphoria continue – are in the $379 area first and then $388.
Click here to access our Economic Calendar
Marco Turatti
Market Analyst
Disclaimer: This material is provided as a general marketing communication for information purposes only and does not constitute an independent investment research. Nothing in this communication contains, or should be considered as containing, an investment advice or an investment recommendation or a solicitation for the purpose of buying or selling of any financial instrument. All information provided is gathered from reputable sources and any information containing an indication of past performance is not a guarantee or reliable indicator of future performance. Users acknowledge that any investment in Leveraged Products is characterized by a certain degree of uncertainty and that any investment of this nature involves a high level of risk for which the users are solely responsible and liable. We assume no liability for any loss arising from any investment made based on the information provided in this communication. This communication must not be reproduced or further distributed without our prior written permission.


