


USDCHF & EURCHF
Swiss under-performance continues strongly. USDCHF and EURCHF’s impressive rally, now in its 5th week, is at the loftiest level seen since January 2017 and early November 2018 respectively.
The CHF crosses have traded higher on each trading day bar since March 29, raising some suspicion of there having been tactical SNB intervention in the mix. SNB member Maechler earlier in the month said that while the Swiss economy remains dynamic and the global economy should remain solid, inflation pressures remain very weak and the environment is fragile, which continues to warrant expansionary monetary policy.
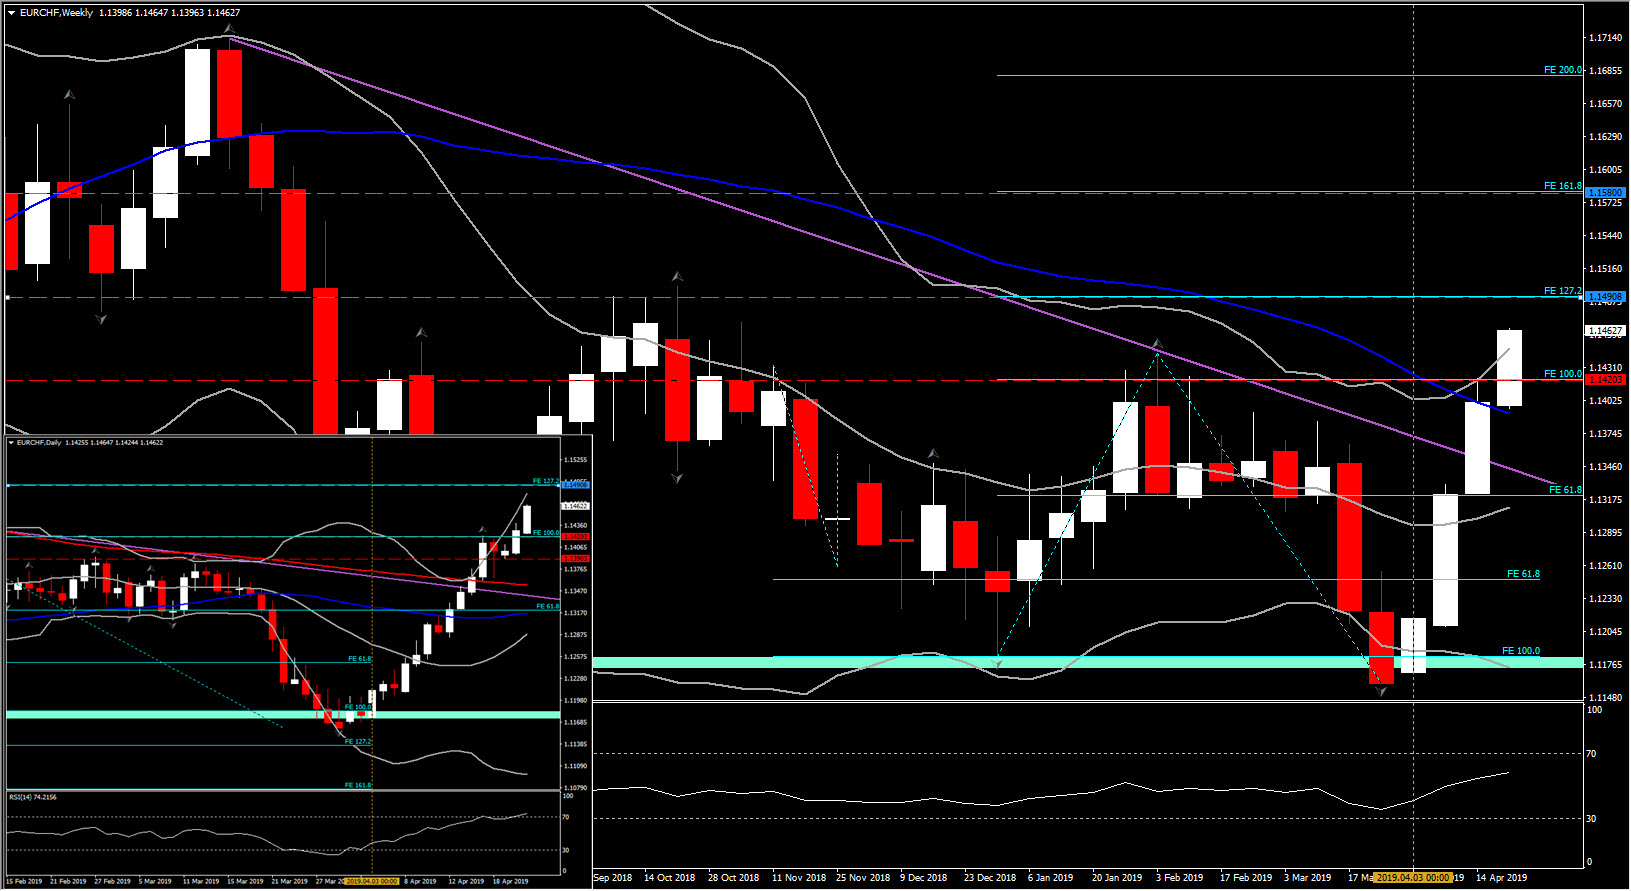
EURCHF has continued with the cross printing a fresh trend high of 1.1460. The EURCHF cross has been seeing choppy directional impulses since the start of the year, often times characterized by bouts of pronounced underperformance in the Swiss franc that have often been accompanied by talk/suspicions of SNB intervention.
However now direction in the medium term holds strongly to the upside, as the weekly Bollinger is extending further to the upside and the weekly RSI has crossed 50, looking to the upside. Hence the sharp incline doesn’t look to be reaching an end yet. The next Resistance level to be watched is at 1.1490 (8-month Resistance and also the confluence of the 20-week SMA and 127.2 Fibonacci extension). Further gains could trigger the attention towards 1.1580 (June-September 2018 Resistance and 161.8 Fibonacci extension)
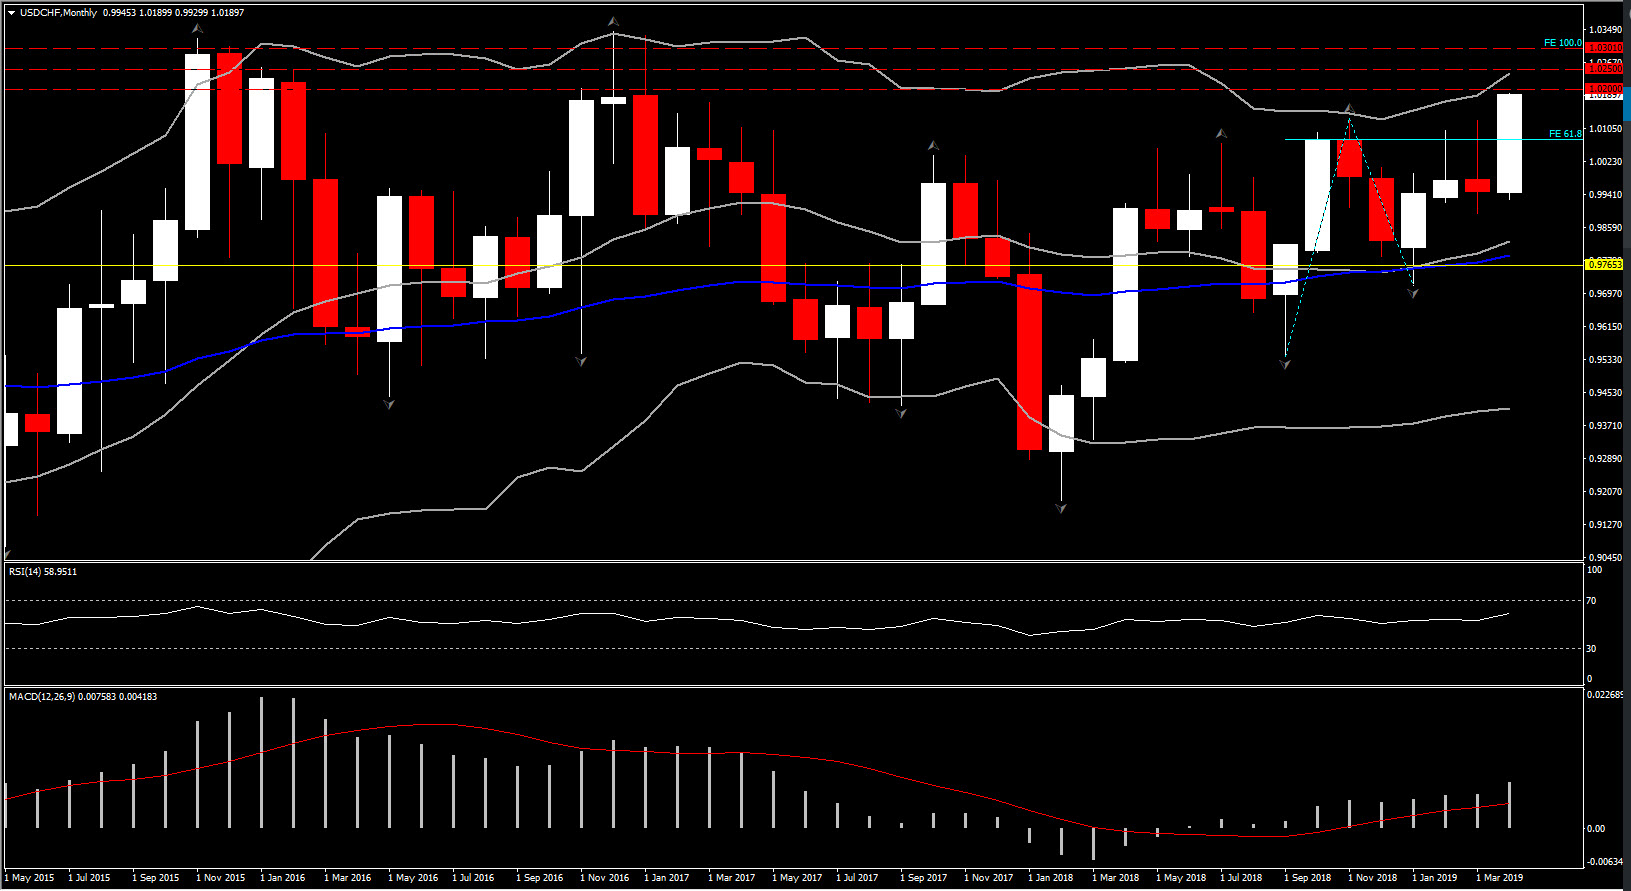
USDCHF rose to a near 27-month high after breaking the 1.0188 level. The sharp rally, reinforced the possibility of a full retracement of more than 3 years of losses, i.e. up to 1.3400 high.
As for the near term (check the daily chart) the asset is trading outside the upper Bollinger Bands pattern and with RSI in the overbought territory we could face a small correction, with Support coming at 1.0160.
However MACD in the daily and weekly timeframes is extending far above the signal line, indicating an increasing positive bias. The weekly RSI is at 64 sloping positively, suggesting that there is further upside space to be covered, while the asset is trading well above all three daily and weekly SMAs.
Hence momentum indicators along with the full body bullish candles show the possible strengthening of positive outlook for USDCHF, and therefore further depreciation of the Swiss franc.
Next Resistance holds at 1.0250 (Monthly Bollinger Bands upper edge and January-February 2016 Resistance). Immediate Resistance is at 1.0200. A break of 1.0250 level could open the doors towards the 1.0300-1.0330 area (FE100.00 and 3-year high area).
Click here to access the Economic Calendar
Andria Pichidi
Market Analyst
Disclaimer: This material is provided as a general marketing communication for information purposes only and does not constitute an independent investment research. Nothing in this communication contains, or should be considered as containing, an investment advice or an investment recommendation or a solicitation for the purpose of buying or selling of any financial instrument. All information provided is gathered from reputable sources and any information containing an indication of past performance is not a guarantee or reliable indicator of future performance. Users acknowledge that any investment in FX and CFDs products is characterized by a certain degree of uncertainty and that any investment of this nature involves a high level of risk for which the users are solely responsible and liable. We assume no liability for any loss arising from any investment made based on the information provided in this communication. This communication must not be reproduced or further distributed without our prior written permission.


