


Apple, Inc., an American multinational technology company which specializes in the design, manufacture, and sale of smartphones (iPhone), personal computers (Mac), tablets (iPad), wearables and accessories (Apple Watch, Airpods, Apple Beats), TVs (Apple TV) and other varieties of related services (iCloud, digital content stores, streaming, licensing services), shall release its Q2 2024 earnings result on 2nd May (Thursday), after market close.
Apple took the reins in the market capitalization, overtaking Microsoft shortly after the latter crossed the $1 trillion milestone. What lies ahead for this conglomerate with the market capitalization at over $2.6 trillion?
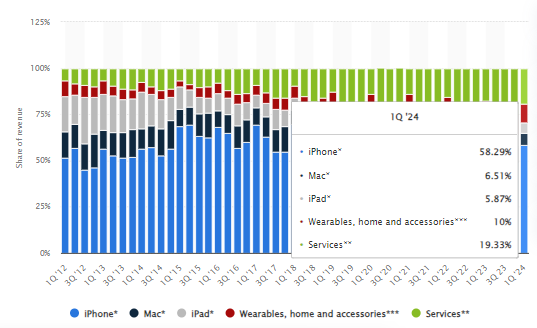
In general, Apple. Inc is still heavily relying on the sales of hardware devices, which generated $96B (nearly 81%) out of the total revenue $119.6B in the previous quarter. Its Services segment has hit an all-time revenue record. The official statement has shown iPhone sales revenue being up nearly 6% (y/y) to $69.7B. However, recent studies have shown that Apple’s smartphone shipments fell 9.6% (y/y) to 50.1 million units in Q1 2024, triggered by a number of headwinds including increased competition and floundering economy in China. The country accounts for about 20% of Apple’s net sales. Last week, Reuters reported that Apple’s smartphone market share in China dropped to 15.7% in the first three months of the year from 19.7% in Q1 2023.
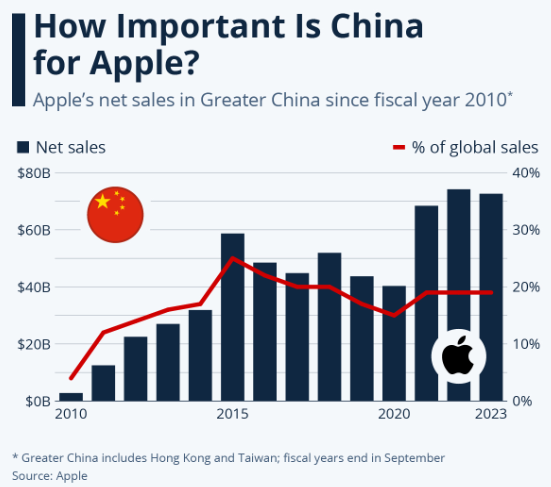
苹果在大中华区的净销售额。来源: Statista
Other issues such as regulatory challenges, a more cautious and rational spending sentiment, constant hang over of geopolitical specter, running behind competitor trends (some smartphone brands have been equipped with AI features, whilst Apple shall only release its AI features available in iOS 18, scheduled to be announced on June 10 at the Worldwide Developers Conference (WDDC)) continue adding woes to Apple. Inc.
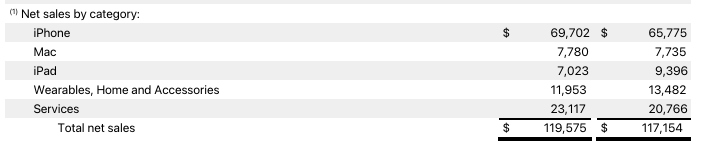
Mac sales revenue remained flat in the previous quarter, while the other two categories – iPad, Wearables, Home and Accessories saw sales revenue declining from the same period last year. The slump in iPad sales of over 25% (y/y) was no surprise due to a lack of progress in innovation, since the company didn’t release a new iPad model in 2023 for the first time in the product’s history. On the contrary, Wearables, Home and Accessories have been negatively impacted by a patent dispute with medical device company Masimo.
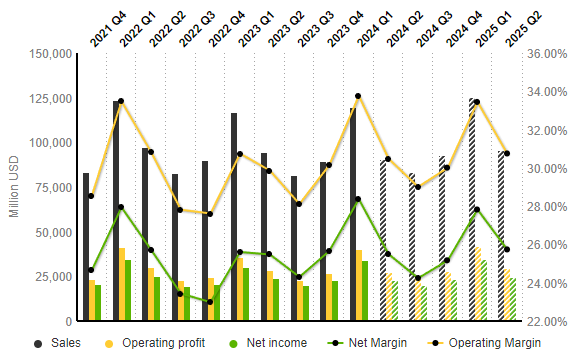
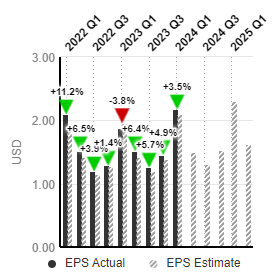
Sentiment inclines towards pessimism in the coming quarter announcement. According to projections by the S&P Global Market Intelligence, sales revenue of Apple Inc is expected to reach $90.6B, down over -24% from the previous quarter, and down over -4% from the same period last year. Operating profit and net income are estimated at $27.6B and $23.10B (was $40.4B and $33.9B in the previous quarter).
As a result, operating margin is projected down -3.26% (q/q) to 30.48%, whereas net margin is expected down -2.86% (q/q) to 25.50%.
EPS is estimated to hit $1.49, down over -31% from the previous quarter’s $2.18. It was $1.52 in Q2 2023.
Techical Analysis:
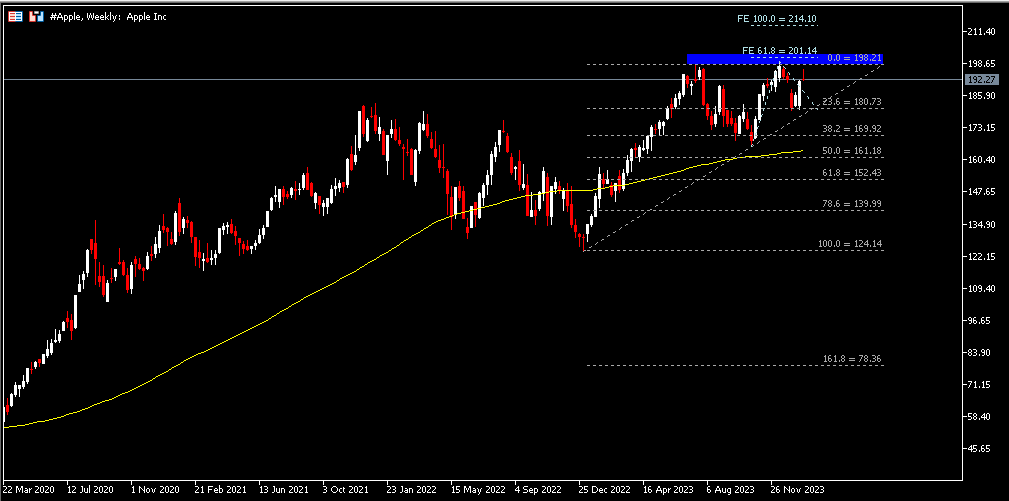
#Apple, Weekly: The company share price closed higher above 100-week SMA, retesting the previous low at $170.80 (FR 38.2%, extended from the lows in January 2023 to the ATH seen in December 2023). The RSI and Stochastics indicators remain below 50, yet still far from the oversold zone. While recent direction pointed towards bearish, market participants are awaiting the earnings result. A better-than-expected earnings outcome may encourage the bulls to break the nearest resistance at $170.80 (FR 38.2%), followed by $181.80 (FR 23.6%). Otherwise, the 100-week SMA serves as the nearest dynamic support. A successful breakout below the moving average may lead to sellers targeting the next level at $153 (FR 61.8%).
Click here to access our Economic Calendar
Larince Zhang
Market Analyst
Disclaimer: This material is provided as a general marketing communication for information purposes only and does not constitute an independent investment research. Nothing in this communication contains, or should be considered as containing, an investment advice or an investment recommendation or a solicitation for the purpose of buying or selling of any financial instrument. All information provided is gathered from reputable sources and any information containing an indication of past performance is not a guarantee or reliable indicator of future performance. Users acknowledge that any investment in Leveraged Products is characterized by a certain degree of uncertainty and that any investment of this nature involves a high level of risk for which the users are solely responsible and liable. We assume no liability for any loss arising from any investment made based on the information provided in this communication. This communication must not be reproduced or further distributed without our prior written permission.


