


USA500, H4 and Daily
The month of May saw stocks pummeled, while most core 10-year yields tumbled to multi-year lows, as an escalation in tariff pressures heightened fears that a global recession is becoming unavoidable. Yet, US data through May have generally defied expectations that trade frictions will be a major drag on growth. However, markets will keep a close eye on the bubbling US-China trade dispute, a potential US-Mexico skirmish, Brexit uncertainties, and the ECB’s decision, rather than on economic data.
Tariffs threats flustered financial markets last week, prompting flight to safety into bonds, and mostly into Treasuries, as stock markets in Asia and US equity futures saw renewed selling. The MSCI Asia-Pacific (ex-Japan) index hit a new four-month low, while USA500 futures are showing a 0.5% loss in overnight trade.
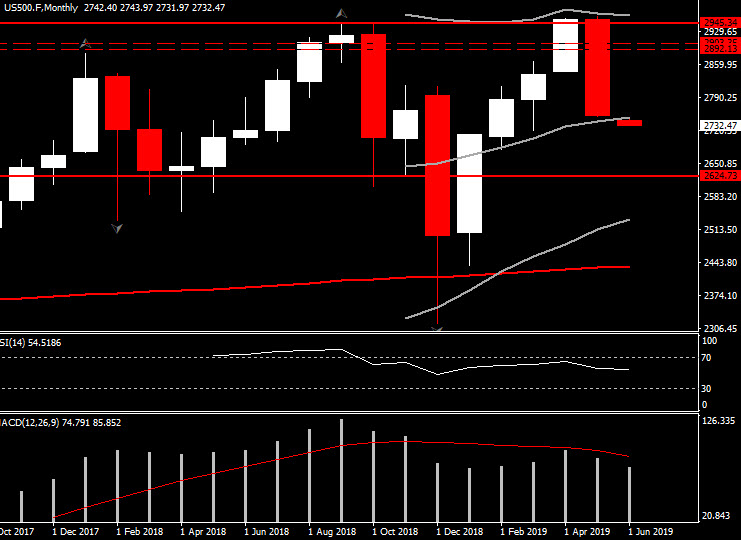
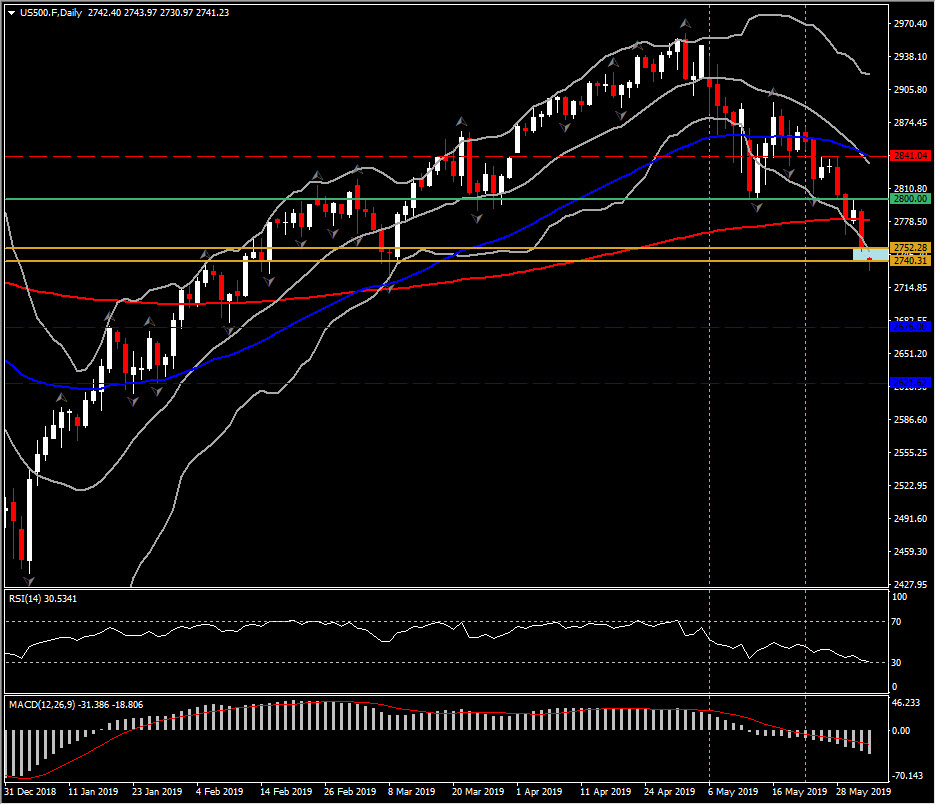
It might look that USA500 is a bit obsolete to be traded, however, the monthly closing looks interesting. The nearly full body bearish May candle implies to a medium term negative outlook. On the other hand, however, in the near term (look daily chart) the technicals are looking overstretched, along with the gap found this morning.
Several gaps have been identified in the USA500 last month, where some of them could be very enlightening regarding index’s analytical insights, as different types of gaps indicate whether a trend is starting, accelerating, or is near its end. Interestingly, the USA500 gapped lower on May 3, by posting a breakaway gap, which pushed the price below 2-week’s range. The gap was never fully filled in the following days, while sentiment of the asset turned to negative and a sharp decline has been seen since then. A 3-day incline in the mid of May was unable to change the overall negative bias.
The gap seen this morning, the 1st working day of June, seems to be a Runaway gap (not confirmed yet), as the downtrend has been underway for a while, and hence traders looks like they were just waiting for another excuse to jump in. The ongoing Geopolitical uncertainties into the new week/month renewed selling.
As June started, geopolitical trade tensions remain in focus with China’s implementation of retaliatory tariff hikes on Saturday. Chinese officials also plan moves against “unreliable” foreign companies and is planning to present its own list of “violators”. President Trump meanwhile, waded into the Brexit debate as he arrives in the UK and the latest escalation of trade tensions and no-deal Brexit risks has prompted traders to revise forecasts and start looking for rate cuts.
Meanwhile, the technical indicators are strongly configured to the downside, with daily RSI at 24, and MACD lines keep stretching below the signal line , something that suggests the strengthening of the negative momentum. Therefore, a continuation of the downside, without any significant peak above the gap and up to 2,800 Resistance level (2-week Support), is expected. Next Support comes at 2,676 (February’s low and January Resistance) and the 2,621.
In the near-term nevertheless, the price action outside of the Bollinger Bands could see correction to the upside as the asset is oversold. Immediate Resistance levels are set at: 2,752.28 and 2,770.80.
Click here to access the Economic Calendar
Andria Pichidi
Market Analyst
Disclaimer: This material is provided as a general marketing communication for information purposes only and does not constitute an independent investment research. Nothing in this communication contains, or should be considered as containing, an investment advice or an investment recommendation or a solicitation for the purpose of buying or selling of any financial instrument. All information provided is gathered from reputable sources and any information containing an indication of past performance is not a guarantee or reliable indicator of future performance. Users acknowledge that any investment in FX and CFDs products is characterized by a certain degree of uncertainty and that any investment of this nature involves a high level of risk for which the users are solely responsible and liable. We assume no liability for any loss arising from any investment made based on the information provided in this communication. This communication must not be reproduced or further distributed without our prior written permission.


