The IEA has cut its 2019 estimate for oil demand in its latest monthly report, blaming trade tensions and the associated consequences on the outlook for global growth. The agency stated that the worsening trade outlook is “a common theme across all regions,” and that “the consequences for oil demand are becoming apparent.”
USOIL prices are presently down 0.3% on the day, at $52.12. Crude prices rallied yesterday following news that two oil tankers had been attacked in the Gulf of Oman, which the US has blamed on Iran. Developments on this front warrant close scrutiny, though for now crude looks to be remaining in the grip of an overall bear trend.
The WTI benchmark (USOIL) prices are down 3.6% w/w and by over 16% from month-ago levels. The IEA stated that US sanctions on Iranian and Venezuelan supply, and OPEC-led output quotas, along with disrupted Libyan supply, are only having a limited impact on supply, while surging US supply and increased production from Brazil, Canada and Norway would add to an increase in non-OPEC supply, estimated to be 1.9 mln bpd this year and 2.3 mln bpd in 2020.
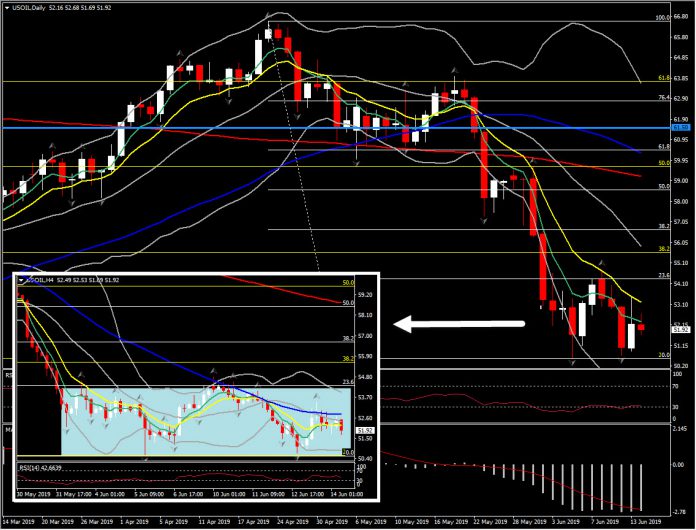
Currently in the commodity markets, USOIL is traded at the low $52 area, with lack of direction so far today but also June in general, as it bounces between $50.50-$54 range. Despite the 2-week consolidation within the range, the asset is forming lower highs this week, supporting USOIL weakness. Hence the medium term outlook remains bearish since mid April, while the upcoming week could be key for the future performance of oil, even though fundamentals are bearish as well.
From the technical perspective, MACD is negatively configured well below neutral zone, while RSI has improved slightly but remains trapped in the oversold zone. Therefore USOIL needs to present a sufficient rally (more than $57) for the negative outlook to change.
Yesterday’s high at $54.43 is the immediate Resistance for the asset. However the Key Resistance and Support levels for USOIL are $54.80 and its 2-week low at $50.15 respectively. A break below the latter could open the doors towards 2018 lows, while a break above Resistance could retest the 38.2% Fibonacci retracement at $56.60 and the round $57.00 level.
Andria Pichidi
Market Analyst
Disclaimer: This material is provided as a general marketing communication for information purposes only and does not constitute an independent investment research. Nothing in this communication contains, or should be considered as containing, an investment advice or an investment recommendation or a solicitation for the purpose of buying or selling of any financial instrument. All information provided is gathered from reputable sources and any information containing an indication of past performance is not a guarantee or reliable indicator of future performance. Users acknowledge that any investment in Leveraged Products is characterized by a certain degree of uncertainty and that any investment of this nature involves a high level of risk for which the users are solely responsible and liable. We assume no liability for any loss arising from any investment made based on the information provided in this communication. This communication must not be reproduced or further distributed without our prior written permission.


