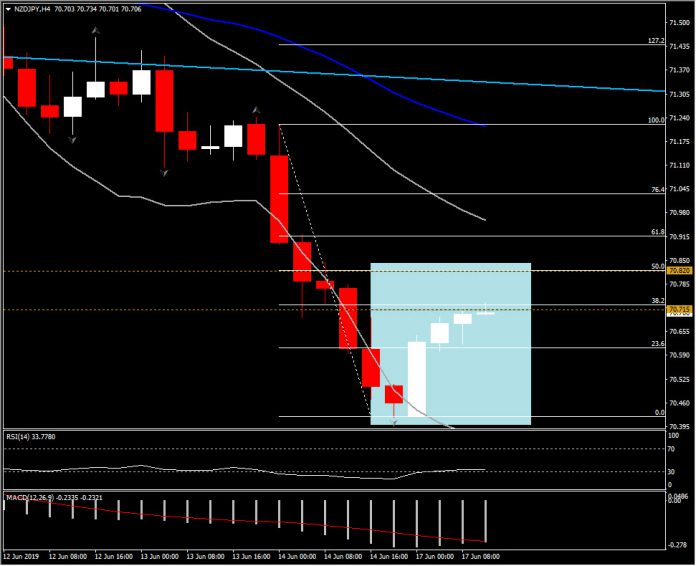
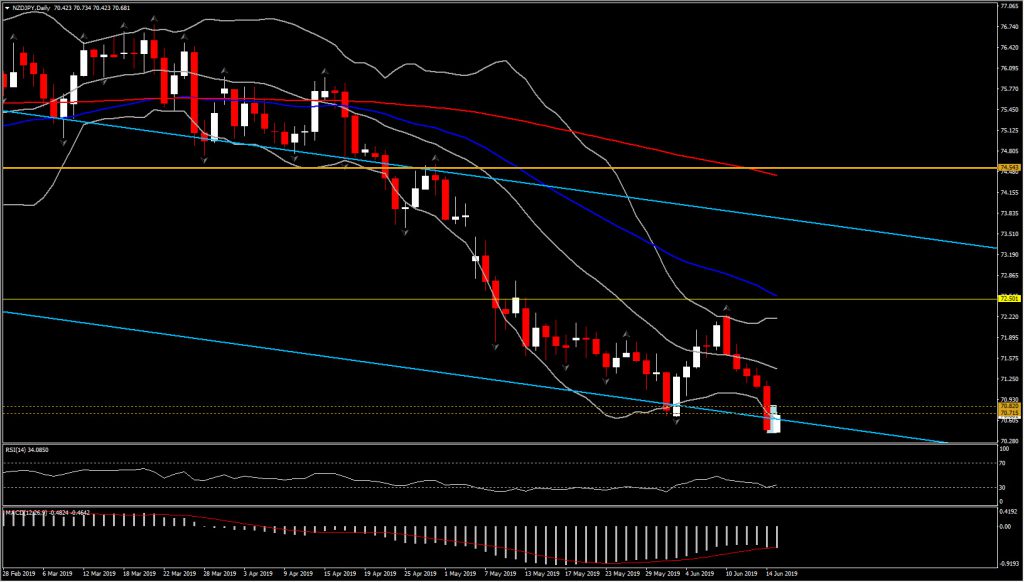
NZDJPY has remained buoyant at 70.70 after bouncing from a 5-month low on Friday at 70.42, on Yen selling. This price action comes with there being little directional impulse in stock markets in Europe or Asia, but also as Kiwi leads gains since Asia Pacific trading amid better risk sentiment.
Markets are anticipating major central banks to maintain their accommodative policy postures if not to suggest a more dovish stance. The Fed, BoJ, and BoE all meet this week and though none is expected to change rates, market participants will be eager to gauge any shift in tone.
In Japan, the BoJ meets Wednesday-Thursday, and it is widely expected to maintain unchanged policy, attached with more-stimulus-if-needed-down-the-road guidance. Last week, Governor Kuroda told Bloomberg that the central bank had further tools in its stimulus toolkit, though he said further accommodation was not needed at the present juncture.
In data, Japan’s May trade report (Wednesday) should see the prior JPY 56.8 bln surplus flip to a JPY 1,000 bln deficit. May national CPI (Friday) should see overall inflation fall to 0.6% y/y from 0.9%, while on a core basis, we expect a 0.5% y/y reading versus 0.9% in April.
Both the BoJ and this week’s data releases are unlikely to have much directional bearing on the Yen. US-China trade tensions have taken a back seat ahead of next week’s G20 gathering, although the lack of preparatory ministerial-level meetings before the summit suggests that the best that could be hoped for is cordiality between the two sides. If not, the is JPY expected to resume its upwards path, driven by safe-haven demand.
Hence, the pair could return down to year’s lows. Today’s under-performance of the Yen reflects the overbought performance of the Yen so far, hence it looks like a correction of the trend.
As the asset moved to the upside so far today, and on the break of the latest up fractal at 70.71, further intraday incline is expected, with next immediate Resistance at 70.80-70.85 (50-period EMA in the hourly chart and midpoint of Friday’s bearish candle). Support is set at 70.60 (23.6% Fib level). A closing today above 70.85 could suggest the retest of a 20-day EMA at 71.40 within the week, however, this scenario looks doubtful, as intraday bullish candles look to shrink something that suggests that incline is already running out of steam.
Hourly momentum indicators have been improved, however, they are still negatively configured. The daily momentum indicators continue to signal further downwards movement for the asset, with MACD lines forming a bearish cross within the negative area and RSI close to 30.
Therefore, overall outlook remains bearish for the asset from the technical but also the fundamental perspective. Medium term Resistance is set at 71.20 (Friday’s peak), 71.40 (20-day SMA). Support at 70.35 (day’s low).
Andria Pichidi
Market Analyst
Disclaimer: This material is provided as a general marketing communication for information purposes only and does not constitute an independent investment research. Nothing in this communication contains, or should be considered as containing, an investment advice or an investment recommendation or a solicitation for the purpose of buying or selling of any financial instrument. All information provided is gathered from reputable sources and any information containing an indication of past performance is not a guarantee or reliable indicator of future performance. Users acknowledge that any investment in Leveraged Products is characterized by a certain degree of uncertainty and that any investment of this nature involves a high level of risk for which the users are solely responsible and liable. We assume no liability for any loss arising from any investment made based on the information provided in this communication. This communication must not be reproduced or further distributed without our prior written permission.


