EUR: Retests 50-day SMA
|
Asset
|
Daily bias | Day’s Range |
|---|---|---|
|
EURUSD
1.1048
|
Ranging intraday sentiment | 1.1026 – 1.1058 |
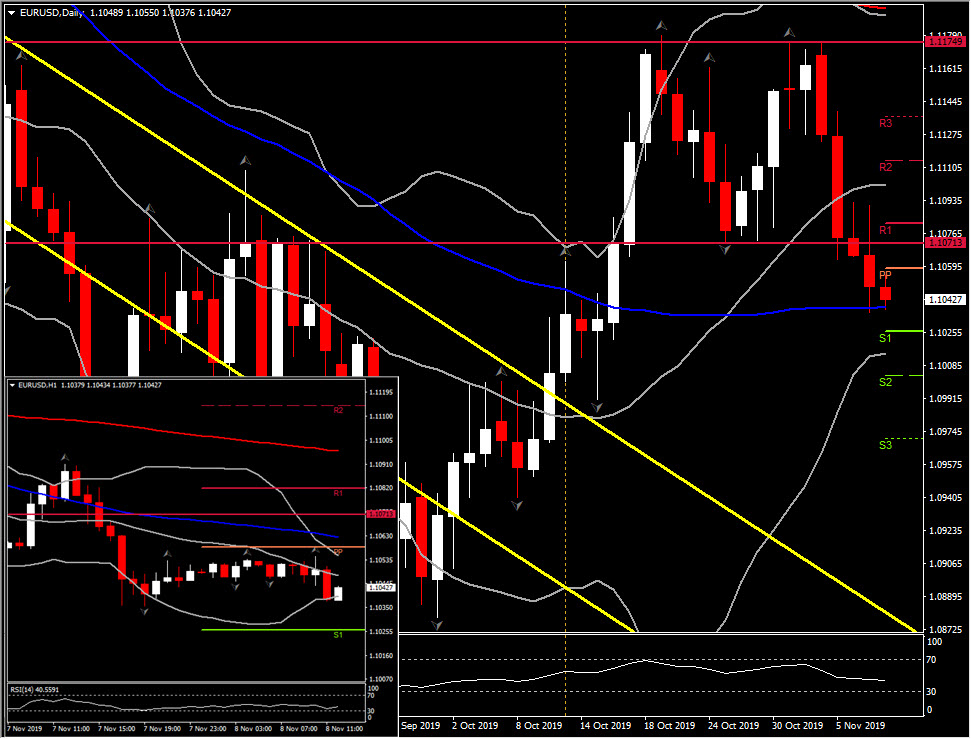
- EURUSD has been plying a narrow range near 1.1050, above the 23-month low seen yesterday at 1.1036. The pair is showing a net loss of just over 1% from week-ago levels, coming after the surprisingly strong US jobs report of last Friday, and followed up this week by decent non-manufacturing ISM and initial jobless claims data. A sputtering Eurozone economy has been put into relatively sharp contrast by data showing the US economy to be in finer fettle than many were fearing, while the CME’s FedWatch Tool is showing market pricing to have factored in decreasing probability for a rate cut at the December FOMC, at only 5% down from 22% last week (before the October payrolls release).
- Overall, EURUSD holds in a bearish outlook. EURUSD has been amid a bear trend that’s been unfolding since early 2018, from levels around 1.2500, and it is just a breath away from breaking the 50-day SMA. A close today below the latter could see the retest of 1.1000 and 1.0970 levels.
- The trend has coincided with the 10-year T-note versus 10-year Bund yield differential having narrowed from 278 bps to the current 216 bps.
JPY: AUDJPY reverses gains
|
Asset
|
Daily bias | Day’s Range |
|---|---|---|
|
AUDJPY
75.36
|
Bearish | 74.73-75.80 |
- Narrow ranges have been seen so far today among the main currencies, which comes with a degree of uncertainty creeping back in with regard to the prospects of a “phase 1” trade deal being reached between the US and China. There are reports of fierce internal opposition among members of the Trump administration, while there is conjecture that President Trump will be emboldened by recent relatively strong US data releases and the record highs on Wall Street and will be apt to take a tough stance against Beijing. This has seen Asian stock markets turn softer.
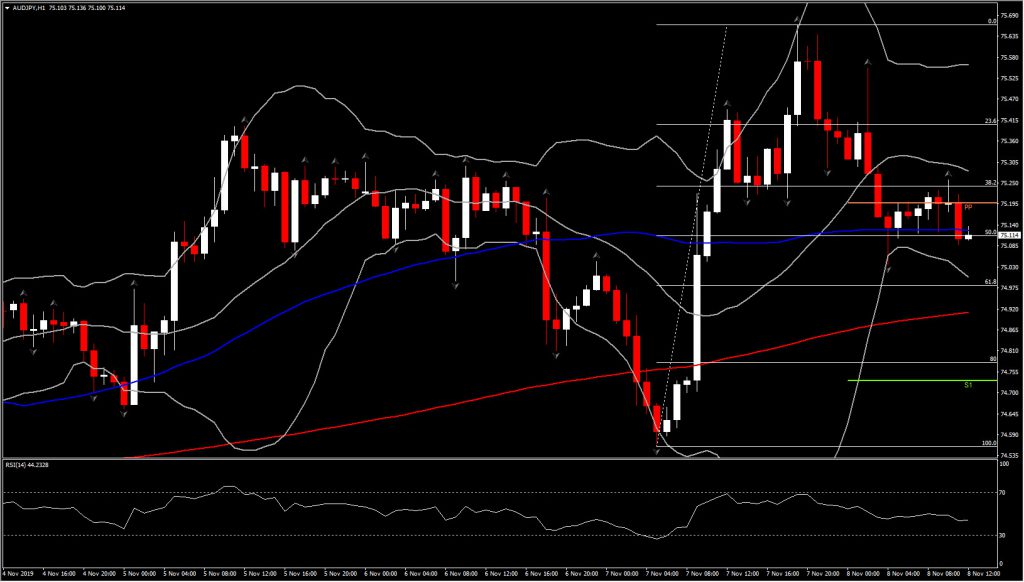
- USDJPY, after scaling to a 5-month high at 109.48, has settled around 109.20-30, while it has currently returned northwards again. AUDJPY, which has been an outperformer amid the recent risk-on phase (showing a 7.4% gain at prevailing levels from late-August lows), has also settled lower after printing a 3-month peak yesterday. It is currently retesting the midpoint of yesterday’s rally. A confirmed move below the latter at the top of the hour, along with the RSI below 50 suggest the increase of negative bias and therefore a possible retest of 74.90-74.98 ( 61.8% Fib and 200-period SMA) or even lower at the S1 of the day, i.e. 74.73. The strengthening of negative bias is also presented by the lower Bollinger bands which are extending southwards.
CAD: Remains buoyant
| Asset | Weekly bias | Week’s Range |
|---|---|---|
|
USDCAD
1.3171
|
Bullish | 1.3118 – 1.3230 |
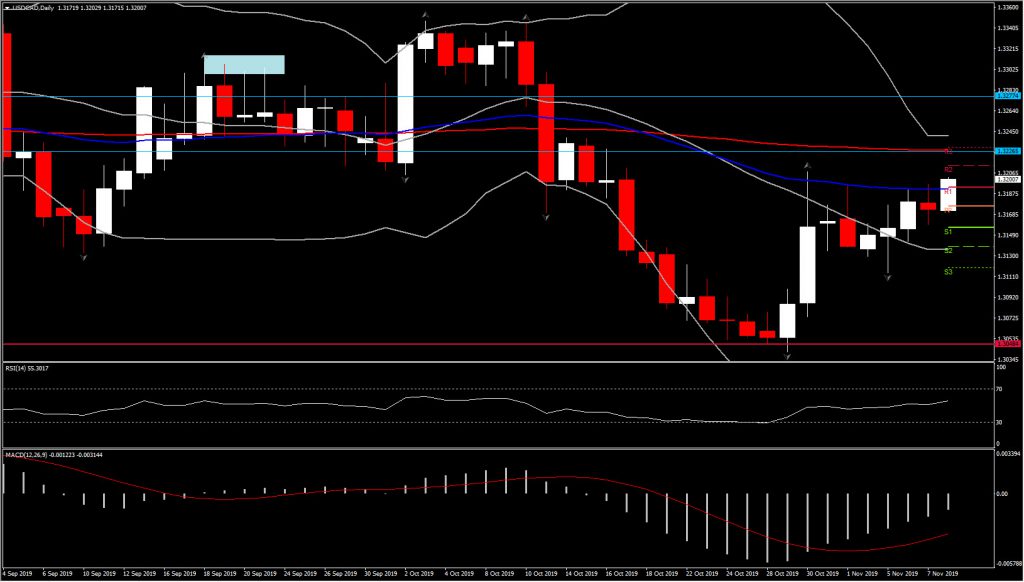
- USDCAD has remained buoyant after posting a 9-day high yesterday at 1.3197. The high has come with the US 10-year over Canadian 10-year yield spread having been trending wider, overall, over the last three weeks, rising from about 19 bp to 29 bp, which has offset a moderate rise in oil prices over this period (oil prices have been trending sideways, within about a $13 range, over the last five months).
- USDCAD earlier in the week printed a 1-week low at 1.3015 before rebounding. Taking a couple of steps back, USDCAD is near to the midpoint of the range that’s been seen over the last 4-plus years, and there presently doesn’t look to be much potential for this pattern to break. The focus today falls on Canada’s October employment report. From the technical perspective, the asset has broken a significant Resistance level at 1.3195, which represents the 50-day EMA and the 6-day high. This along with the positive configuration of RSI suggest that we could see further upside for the day. Next Resistance levels are at 1.3213 and 1.3230 (200-day EMA). Support is at the PP and the low of the day, i.e. 1.3170-1.3176.
Click here to access the HotForex Economic calendar.
Andria Pichidi
Market Analyst
Disclaimer: This material is provided as a general marketing communication for information purposes only and does not constitute an independent investment research. Nothing in this communication contains, or should be considered as containing, an investment advice or an investment recommendation or a solicitation for the purpose of buying or selling of any financial instrument. All information provided is gathered from reputable sources and any information containing an indication of past performance is not a guarantee or reliable indicator of future performance. Users acknowledge that any investment in Leveraged Products is characterized by a certain degree of uncertainty and that any investment of this nature involves a high level of risk for which the users are solely responsible and liable. We assume no liability for any loss arising from any investment made based on the information provided in this communication. This communication must not be reproduced or further distributed without our prior written permission.


