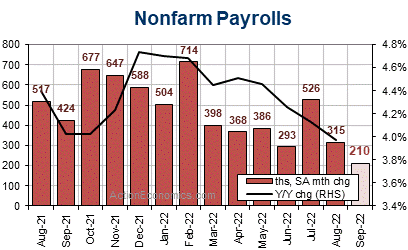
The September payroll forecast is for a 210k increase after a 315k increase in August. The workweek is anticipated to hold steady from 34.5 in August, alongside a 0.1% hours-worked rise and a 0.3% gain for hourly earnings. The jobless rate should tick down to 3.6% after a rise to 3.7% in August from the cycle-low 3.5% in July. The impressive pace for job growth through July sharply outpaced GDP, which posted a -0.6% Q2 contraction rate after a -1.6% drop in Q1.
The risk is for payroll undershoots in each remaining month of 2022. Consumer confidence and producer sentiment continue to fall, alongside up-trends in initial claims and now continuing claims as well.
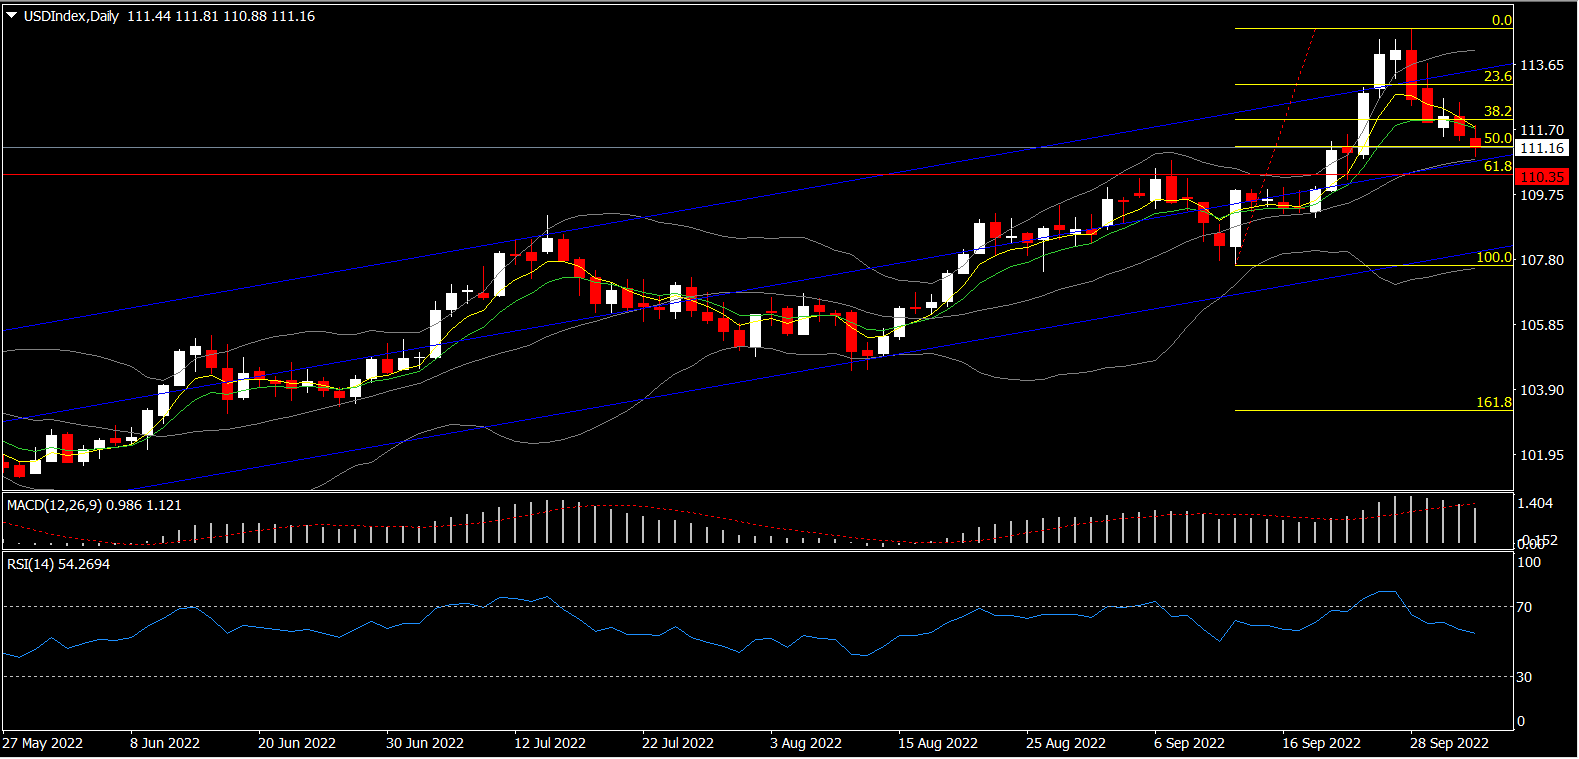
October kicked off with big gains in bonds and stocks and a pullback in the USDIndex. The USDIndex was softer on the tempering in the FOMC outlook and closed at the 111.00 handle. A disappointing NFP report this Friday could add pressure on the asset, with nearest support level at the 110.30 area.
Price is still in an uptrend and the probability is for bulls to resume buying at the lower end of the range if the reversal pattern yields an impulsive wave after breaking to the upside. Conversely, if price breaks below the 110.30 area impulsively and breaks the major uptrend too, sellers could take control of the market and drive price down towards the 109.09 area which represents the next higher-low structure.
Breakdown
 The 210k nonfarm payroll forecast includes a 180k private jobs increase. The goods based employment increase is pegged at 45k, after gains of 45k in August and 66k in July. Construction employment is seen rising 20k after 16k in August, and 24k in July, while factory jobs rise 20k after a 22k August gain. The private service job sector should increase 136k in September, after gains of 263k in August and 411k in July. A 30k climb in government employment could be seen, after a 7k rise in August and 49k in July.
Hourly Earnings
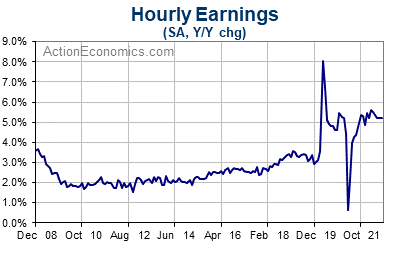
We expect a 0.3% September average hourly earnings rise, following gains of 0.3% in August, 0.5% in July and 0.4% in both June and May. We expect y/y wage growth to dip to 5.0% from 5.2% in the three months before, with a downtrend reflecting the continuing return of lower-paid workers to the labor pool. Prior to the pandemic, growth in hourly earnings was gradually climbing from the 2% trough area between 2010 and 2014 to the 3%+ area until the pandemic-induced spike.

The ECI data are designed to avoid distortion from the shift in the composition of jobs that has sharply impacted the payroll report’s wage measure through the pandemic. The ECI revealed a 1.3% Q2 rise, following a 1.4% pop in Q1 that marked a 38-year high previously seen in Q3 of 1989. The y/y ECI gauge rose to a 32-year high of 5.1% in Q2, eclipsing a prior high of 4.5% in Q1. For the components, we saw a 1.4% Q1 gain for wages and sales, which undershot the 1.5% increase in Q3 of 2021 that marked a 40-year high. Benefit costs rose 1.2% after a 1.8% gain in Q1 that left an 18-year high. For the y/y component gains, we saw a 5.3% gain for wages and salaries that marked a 39-year high. We saw a 4.8% Q2 y/y benefit cost gain that marked a 17-year high.
Continuing and Initial Claims
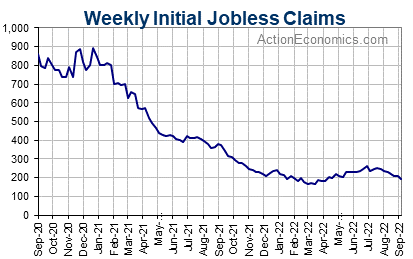
Continuing claims fell by -90k between the August and September BLS survey weeks, following gains of 47k in August and 41k in July that marked the only two increases since May of 2020. We expect an initial claims average of 207k in September, following 237k in August, an 8-month high of 247k in July, and a cycle-low of 175k in March. We saw BLS survey week readings of 209k in September, 245k in August, and 261k in July, versus a cycle-low of 177k in March. The September tightening in claims trims the downside risk for our 210k September payroll estimate, though we’ve still seen a net rise in both initial and continuing claims in March and May, respectively.

The 4-week average for initial claims has a strong inverse relationship with the monthly payroll gain. Until the massive claims surge caused by COVID-19, claims had been surprisingly tight relative to the rate of job growth, presumably due to reduced job churn in the latter half of the last expansion. This relationship has taken a wild ride since COVID-19 due to big swings in job churn, and initial claims won’t be particularly useful for forecasting payrolls until we see how the series match up in the post-pandemic environment.
Click here to access our Economic Calendar
Andria Pichidi
Market Analyst
Disclaimer: This material is provided as a general marketing communication for information purposes only and does not constitute an independent investment research. Nothing in this communication contains, or should be considered as containing, an investment advice or an investment recommendation or a solicitation for the purpose of buying or selling of any financial instrument. All information provided is gathered from reputable sources and any information containing an indication of past performance is not a guarantee or reliable indicator of future performance. Users acknowledge that any investment in Leveraged Products is characterized by a certain degree of uncertainty and that any investment of this nature involves a high level of risk for which the users are solely responsible and liable. We assume no liability for any loss arising from any investment made based on the information provided in this communication. This communication must not be reproduced or further distributed without our prior written permission.


