


At a time when we are already well into the Fed’s tightening cycle, inflation is excessively high, the yield curve is inverted in a way it hasn’t been in almost 50 years (a sign of recession) and some corporate valuations are not far off 2021 levels, traders may be wondering what will happen with the US500. A simple (and even surprising answer) is that historically, the US500 doesn’t go consistently down until the Jobless Claims go up.
Of course things are much more complicated than that: this could possibly be one of many factors involved and relation does not mean causation (and not even correlation). However, trends deserve to be observed; after all, keeping things simple is one of the best strategies to really understand them.
Continuing Jobless Claims (inv.), US500, US Official Interest Rates (upper panel)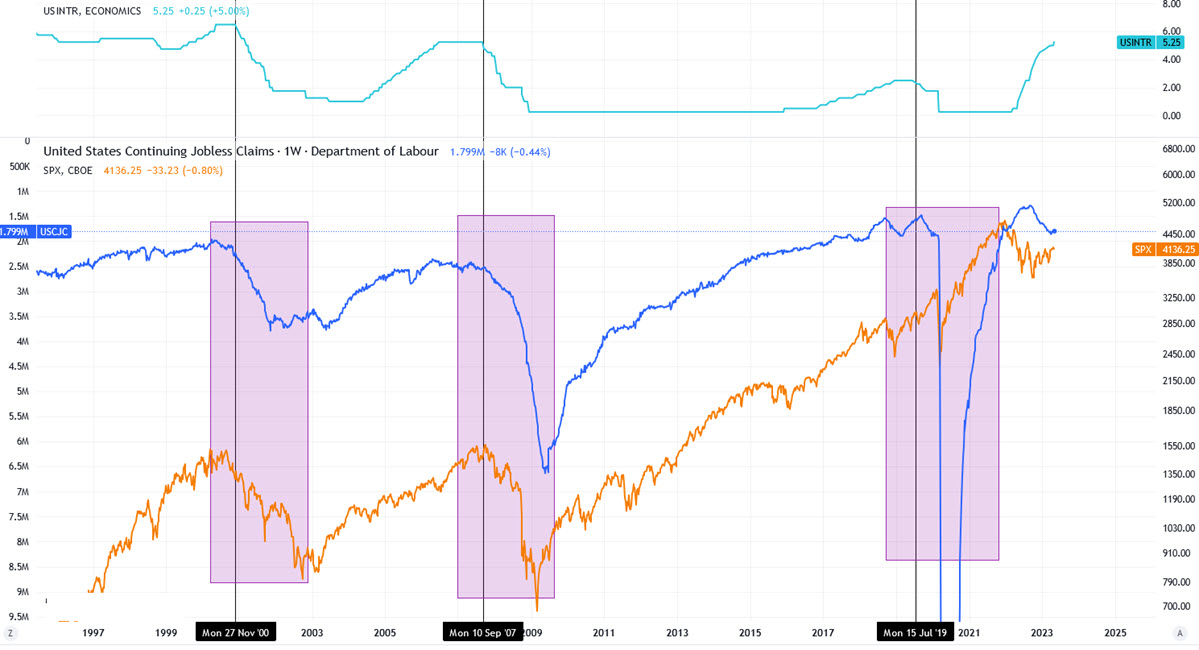
The chart above shows 3 time series all together: in the upper panel, the official US interest rate; in the lower panel, the US500 (orange, logarithmic scale) and the Continuing Jobless Claims (blue, inverted). Starting from this latter panel, it is surprising how accurately the US500 collapsed when continuous claims were rising strongly in Nov 2000, Aug 2007 and Fall 2019. In the first 2 cases it is also striking how at the same time as claims stabilised, so did the US500. If we looked at the initial claims, they would be even more accurate in indicating the start of a decline and would begin to improve before the index would bottom.
What is equally interesting is to look at the top panel and the US official interest rate. This, over the last 25 years at least, has always reached a cycle top before the economic and stock market situation worsened. In this sense we can draw another useful conclusion regarding the current environment.
But where is the labour situation heading?
Continuing Claims (inv.) , Job Openings, Job cuts (lower panel)
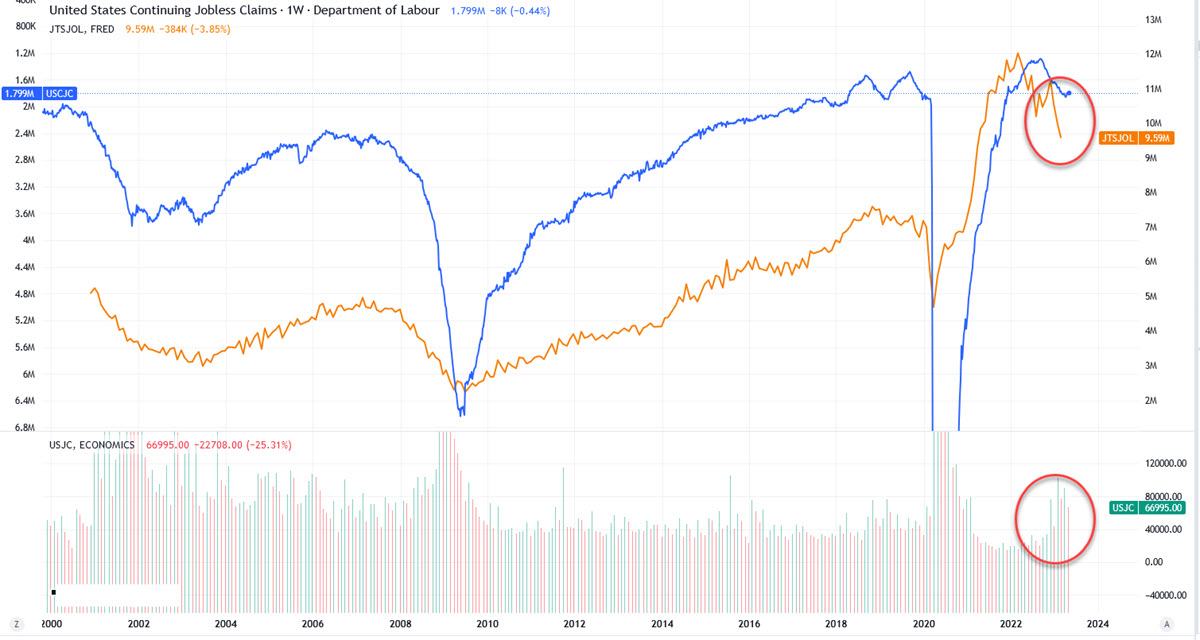
This time we have US job openings (in orange) and, in the lower panel, US job cuts (Challenger Job Cuts) to the chart. Jobless Claims have remained stable in recent months at around 1,800k after a small increase in the number that started last autumn. This is the headline data. BUT both Job Openings have dropped by 384,000 to 9.6 million in March 2023 (consistently down from the 12 million print in early 2022) and US-based employers announced 66.995K Job Cuts in April of 2023 (on the rise starting late 2022).
Meaning that all that glitters is not gold: although the common narrative is still that of a very strong and tight labour market, things are getting worse underground, a factor that should be taken into account when defining a macro scenario.
Continuing Claims are expected to stay flat versus the previous week, at 1.799k; initial consensus is for a 245k print, slightly above last month’s number.
Technical Analysis
A few days ago I wrote about the US500, the tighter 4100-4150 range (the broader 4050–4175) and the last resistance at 4190 (with some free ground towards 4325 in the case it would be broken). The price actually pushed above 4190 and even closed in the 4200 area for 2 days, before being immediately rejected back into the range. MM50 stays now at 4100, ready to support, but this could have been a false break to the upside (a bull trap). We will see.
US500, H1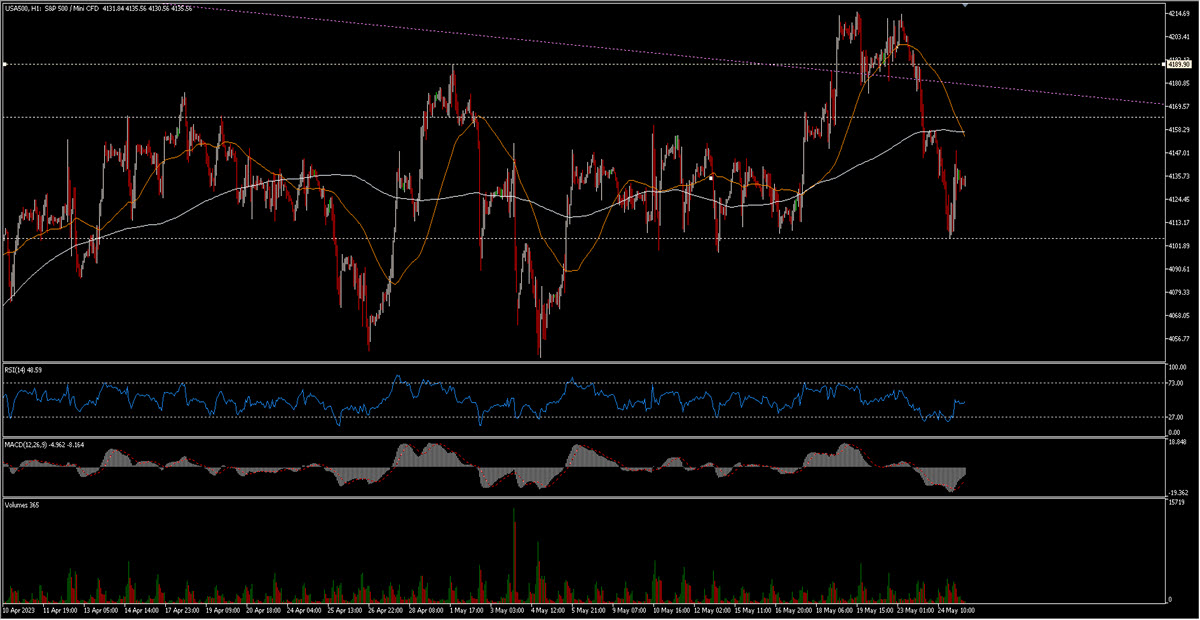
Click here to access our Economic Calendar
Marco Turatti
Market Analyst
Disclaimer: This material is provided as a general marketing communication for information purposes only and does not constitute an independent investment research. Nothing in this communication contains, or should be considered as containing, an investment advice or an investment recommendation or a solicitation for the purpose of buying or selling of any financial instrument. All information provided is gathered from reputable sources and any information containing an indication of past performance is not a guarantee or reliable indicator of future performance. Users acknowledge that any investment in Leveraged Products is characterized by a certain degree of uncertainty and that any investment of this nature involves a high level of risk for which the users are solely responsible and liable. We assume no liability for any loss arising from any investment made based on the information provided in this communication. This communication must not be reproduced or further distributed without our prior written permission.


