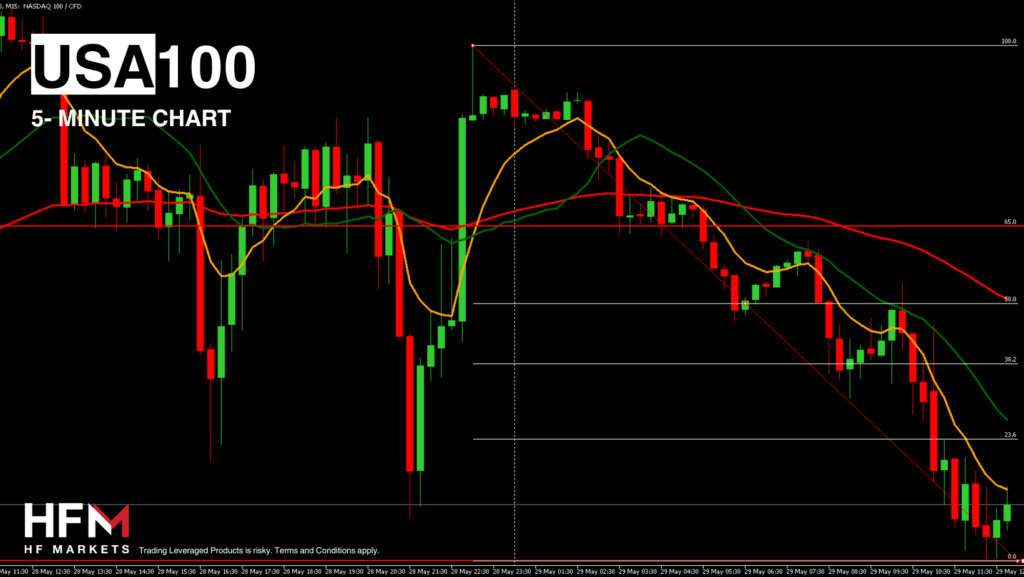
The price of the NASDAQ on Tuesday saw neither buyers nor sellers able to maintain momentum and a direction. However, Wednesday’s European Trading Session indicates a “risk-off” appetite and other economic factors also point towards an intraday decline. The NASDAQ’s price has so far fallen 0.75% which is untraditionally high for pre-trading hours.
When monitoring the global stock market, investors can see a clear trend for the day. The German DAX trades 0.53% lower, the CAC 0.64%, FTSE100 0.28% and the NIKKEI225 is 0.77% lower. The NASDAQ is currently seeing the second largest decline, second only to the NIKKEI225.
When monitoring the components of NASDAQ’s most influential stocks again they are primarily lower. None of the top 15 influential stocks have held onto their value and of the top 50 stocks only 9 are trading higher. Currently, investors are closely monitoring Meta, AMD and Qualcomm which are declining more than 1.00% and hold a high “weight” within the index. In addition to this, Bond Yields are also trading 0.026% higher and the US Dollar Index is up 0.11%. Both these factors are known to provide short-term pressure and traders will closely monitor if these two assets continue to gain as the US Session approaches.
The above indications are largely known to provide signals for the short term such as the day’s price movement. However, investors are also questioning what can potentially be triggering the decline? On one hand, the market is pressured by the end of earnings season and “higher for longer” rates. On the other hand, an interim report on the state of the US economy will be published tomorrow, which is also currently putting pressure on the stock market.
Analysts anticipate a decline in the GDP for the first quarter. Analysts expect the figure to drop to 1.3% from 3.4%, with sales within the GDP expected to fall to 2.0%. The national economic slowdown is partly attributed to the high cost of borrowing, and unless the US Federal Reserve begins to lower interest rates, the GDP may revisit last year’s lows. However, lower interest rates are not likely while inflation remains above 3.00%.
In terms of technical analysis, the price has fallen back to the 75-Bar EMA but not the 100-BAR SMA. If the price drops below the average price, this will trigger more certain sell signals for short-medium term. The breakout point for bearish signals currently stands at $18,761.58 and a buy signal will not become active again unless the price crosses above $18,867 (according to Fibonacci).
Michalis Efthymiou
Market Analyst
Disclaimer: This material is provided as a general marketing communication for information purposes only and does not constitute an independent investment research. Nothing in this communication contains, or should be considered as containing, an investment advice or an investment recommendation or a solicitation for the purpose of buying or selling of any financial instrument. All information provided is gathered from reputable sources and any information containing an indication of past performance is not a guarantee or reliable indicator of future performance. Users acknowledge that any investment in Leveraged Products is characterized by a certain degree of uncertainty and that any investment of this nature involves a high level of risk for which the users are solely responsible and liable. We assume no liability for any loss arising from any investment made based on the information provided in this communication. This communication must not be reproduced or further distributed without our prior written permission.


