Nvidia Corp., an American multinational technology behemoth with market cap over $3.4T (the most valuable company in the world) which specializes in the design and manufacture of computer graphics processors, chipsets and related multimedia software, shall release its earnings report for the fiscal quarter ending October 2024, on 20th November (Wednesday) after market close. What is to be expected for the company which has just joined the DJIA family in its upcoming earnings release?

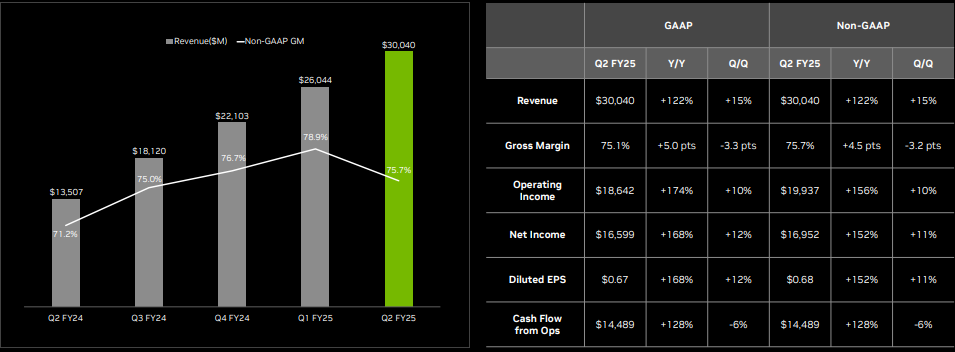
The latest revenue reported by Nvidia hit $30.0B, up 15% and 122%, from Q4 2024 and a year ago, respectively. The continuous growth of Nvidia was mainly buoyed by the ongoing AI boom, with the company dominating the global market share for AI chips between 70% and 95%. Net income was up 12% (q/q) and up 168% (y/y), to $16.6B. Gross margin, however, was slightly down 3.3pts (q/q) to 75.1%, marking the first sequential decline since Q2 2023, which may raise concerns over cost challenges the management is facing as new product lines are being introduced, which includes the ramp up of Blackwell inventory.

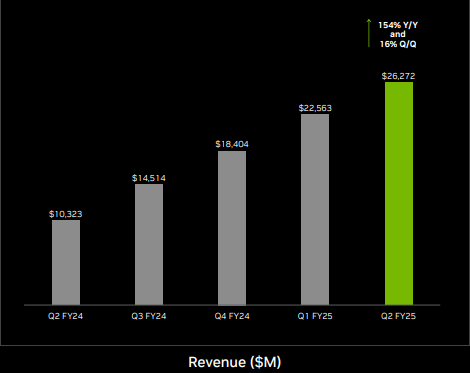
The Data Center segment continued to drive most of the gains. In the previous quarter, it recorded sales revenue worth $26.3B, up over 16% from the previous quarter, and over 154% from the same period last year. Demand for Nvidia Hopper, GPU computing and networking platforms remains robust. According to the management, the shipping of the H200 platform began ramping up in Q2 ( we may see its contribution to the company’s revenue growth in the upcoming quarter result); the Blackwell platform, on the other hand, is expected to ramp up in production in Q4 2025, which is expected to bring in several billion dollars in revenue.

Sales revenue in the Gaming segment was reported at $2.9B, up 8.8% from the previous quarter following growth in console, notebook and desktop, and up over 15% (y/y) from the same period last year. The company’s AI-ready RTX PCs with an installed base of 100 million devices and 600 AI-powered applications and games, as well as the GeForce NOW cloud gaming library, are other features that serve as tailwinds to the segment. On the other hand, Professional Visualization recorded revenue up 6.3% (q/q) and up nearly 20% (y/y) to $454 million, boosted by increasing demand for AI and graphic use cases, including model fine-tuning and workloads related to the Omniverse platform. Some of the large companies have utilized the Omniverse for building industrial digital twins of plants.
Automotive reported revenue at $346 million, up over 5% (q/q) and up over 36% (y/y). A ramp up of new customers in self-driving platforms and the increasing demand for AI cockpit solutions have continued to drive the sales growth of the segment. 。

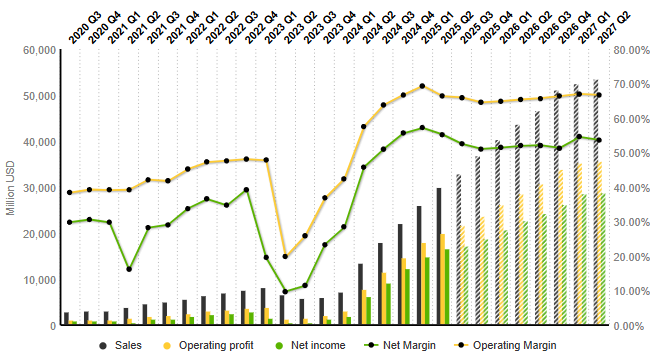
According to projections by S&P Global Market Intelligence, sales revenue is expected to reach $33.0B in the coming quarter, up nearly 10% from the previous quarter, and up over 82% from the same period last year. EBITDA is projected to be up 9.1% from the previous quarter, towards $20.8B. Net income, on the other hand, is expected to hit $17.3B, up slightly over 4% (q/q), and up 87.6% (y/y).
Technical Analysis:
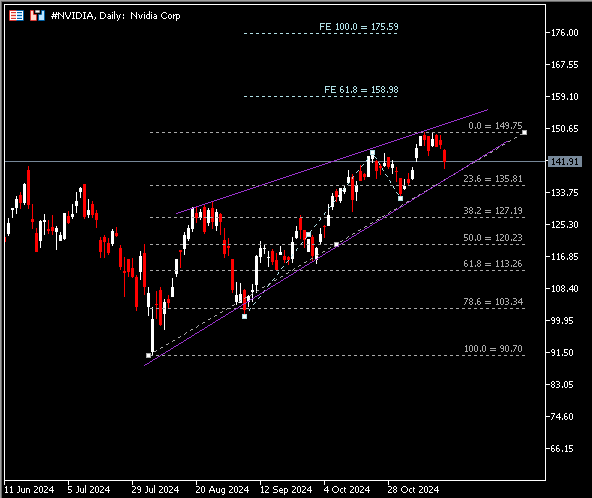
 #NVIDIA, Daily: The Nvidia share price retraced from resistance at $150, which also coincides with the upper line of ascending wedge that the asset traded in. Recent support is seen at the lower line of the wedge as well as $136 (FR 23.6% that extends from the lows seen in August to the highs seen last week). A break below these support levels may indicate selling pressure, towards the next support at $127 (FR 38.2%). On the other hand, nearest resistance is found at psychological level $150, followed by the upper line of the wedge and $159, an FE 61.8% level.
Click here to access our Economic Calendar
Larince Zhang
Market Analyst
Disclaimer: This material is provided as a general marketing communication for information purposes only and does not constitute an independent investment research. Nothing in this communication contains, or should be considered as containing, an investment advice or an investment recommendation or a solicitation for the purpose of buying or selling of any financial instrument. All information provided is gathered from reputable sources and any information containing an indication of past performance is not a guarantee or reliable indicator of future performance. Users acknowledge that any investment in Leveraged Products is characterized by a certain degree of uncertainty and that any investment of this nature involves a high level of risk for which the users are solely responsible and liable. We assume no liability for any loss arising from any investment made based on the information provided in this communication. This communication must not be reproduced or further distributed without our prior written permission.


