


The latest data showed that the eurozone and Germany ‘s services PMI performance in August was not very optimistic. The former fell below 50.0 to 49.8 for the first time since March last year, underperforming expectations and the previous value of 50.2, while the latter remained at a contractionary level for two consecutive months at 47.7. The final composite PMI for the euro area and Germany recorded 48.9 and 46.9, respectively, from 49.2 and 47.6, dragged down by the services PMI data. In addition, the Sentix Investor Confidence Index in the eurozone continued to decline to -31.8 in September, exceeding market expectations of -27.5, from -25.2 previously. It is worth noting that the data has been negative for 7 months, and is currently the lowest since May 2020, reflecting the market’s extremely pessimistic view on the economic development prospects of the eurozone.

Figure 1: Eurozone and German Services PMI:Trading Economics
In the United Kingdom, its August services PMI recorded 50.9, lower than market expectations and the previous value of 52.5. It was its weakest expansion in 18 months due to inflationary pressures (UK inflation is the highest among G10 countries), cost-of-living tightening, economic uncertainty, lower consumer confidence and more. The composite PMI fell to 49.6 from 50.9 previously, the first time the data has fallen below the 50.0 level since February last year.
On the other hand, Liz Truss was elected as new Prime Minister with 57.38% of the vote. She will also announce the list of new cabinet members after her inaugural speech today. Truss has a wide range of issues to address, including soaring inflation, recession risks, energy supplies, climate concerns, a cost-of-living crisis, a wave of employee strikes and international diplomatic relations. Earlier, data showed that UK GDP grew by just 1% in the second quarter of this year. When adjusted, it shrank 0.1%. By contrast, India, a former British colony, has surpassed Britain in GDP since the fourth quarter of last year and became the world’s fifth-largest economy. The International Monetary Fund (IMF) expects the GDP of the UK and India to be $3.38 trillion and $ 3.54 trillion respectively by the end of this year.
Tight energy supplies are expected to continue to weigh on the economies of European countries and the United Kingdom. The governments of these countries are actively taking various measures to reduce the impact of Russia’s suspension of energy supply and are trying to reduce their dependence on Russian energy. On Friday, EU energy ministers will meet. It is reported that the EU may draft a package of measures, including setting a ceiling on natural gas prices, suspending electricity derivatives trading, reducing demand, providing emergency liquidity support for companies, and financing policies to reduce energy costs in the household and SME sector. By contrast, the UK lags behind in emergency aid. According to local manufacturers, soaring energy prices have forced them to reduce operating hours, adjust and reallocate operations to reduce energy consumption, and may even resort to wider layoffs in the future to keep companies afloat.
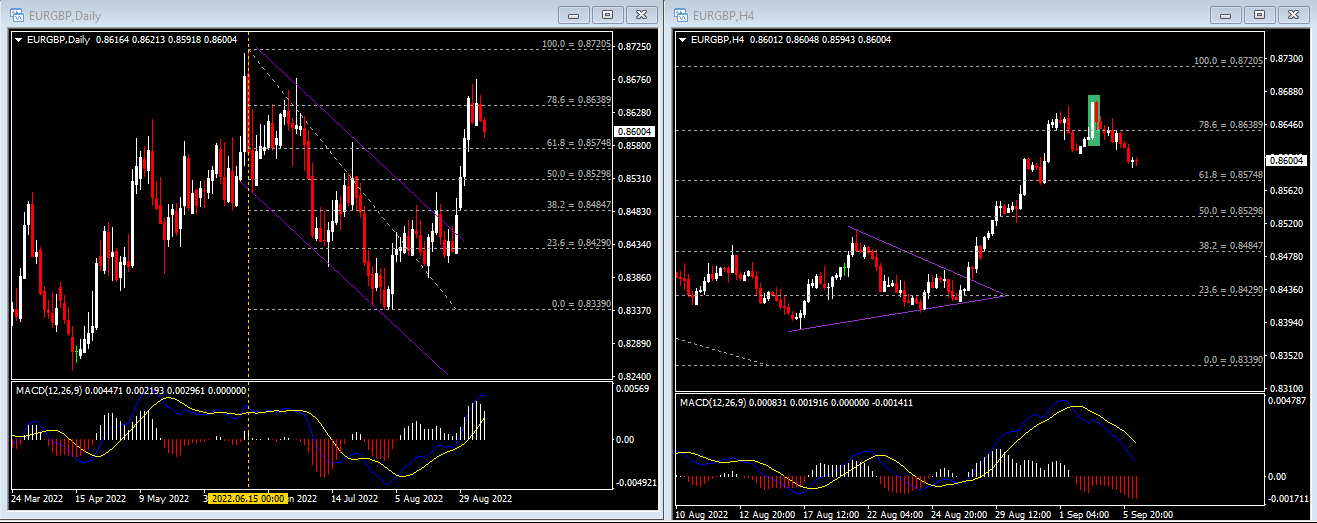
This year, EURGBP posted a low of 0.8202 in the first quarter, before tumbling higher and hitting a high of 0.87205 in mid-June , the highest since February last year. In the third quarter, the pair traded in a descending channel for most of the time, and started a strong uptrend pattern after successfully breaking the top line of the channel on August 26. On Friday, the euro rose to 0.8676 against the pound , approaching the second high of 0.8678 this year , but the key resistance of 0.8640 (FR 78.6%) suppressed the bullish gains. As of yesterday’s close, the currency pair recorded 0.8617, the MACD of the daily chart shows that , its double line is still expanding on the 0 axis, but the white column line is gradually shrinking. The 4-hour chart shows that EURGBP is currently continuing an uptrend pullback pattern after a bearish reversal pattern was established. Near -term resistance remains at 0.8640, followed by recent highs at 0.8676/0.8678. A break above these highs would mean the pair is on track to continue challenging this year’s top at 0.8721. On the other hand, near -term supports are 0.8570 (FR 61.8%), 0.8530 (FR 50.0%) and 0.8485 (FR 38.2%).
Click here to access our Economic Calendar
Larince Zhang
Market Analyst
Disclaimer: This material is provided as a general marketing communication for information purposes only and does not constitute an independent investment research. Nothing in this communication contains, or should be considered as containing, an investment advice or an investment recommendation or a solicitation for the purpose of buying or selling of any financial instrument. All information provided is gathered from reputable sources and any information containing an indication of past performance is not a guarantee or reliable indicator of future performance. Users acknowledge that any investment in Leveraged Products is characterized by a certain degree of uncertainty and that any investment of this nature involves a high level of risk for which the users are solely responsible and liable. We assume no liability for any loss arising from any investment made based on the information provided in this communication. This communication must not be reproduced or further distributed without our prior written permission.


