It is very difficult to define a precise direction for the EURUSD in 2023. In fact, there is nothing more accurate than to say that the pair is stuck in a sideways range between 1.05 and 1.105 and continues to test first one side and then the other. Only recently, at the end of May, has the Euro started to strengthen in the 1.0660 area, marking rising lows compared to March. Actually, in this laterality a very slight tendency to mark both rising lows and rising highs can be seen (yellow channel in Fig.4), but first of all it should be confirmed by the current leg up.
Fig 1. EURUSD max-min range achieved during the year, 1990 – today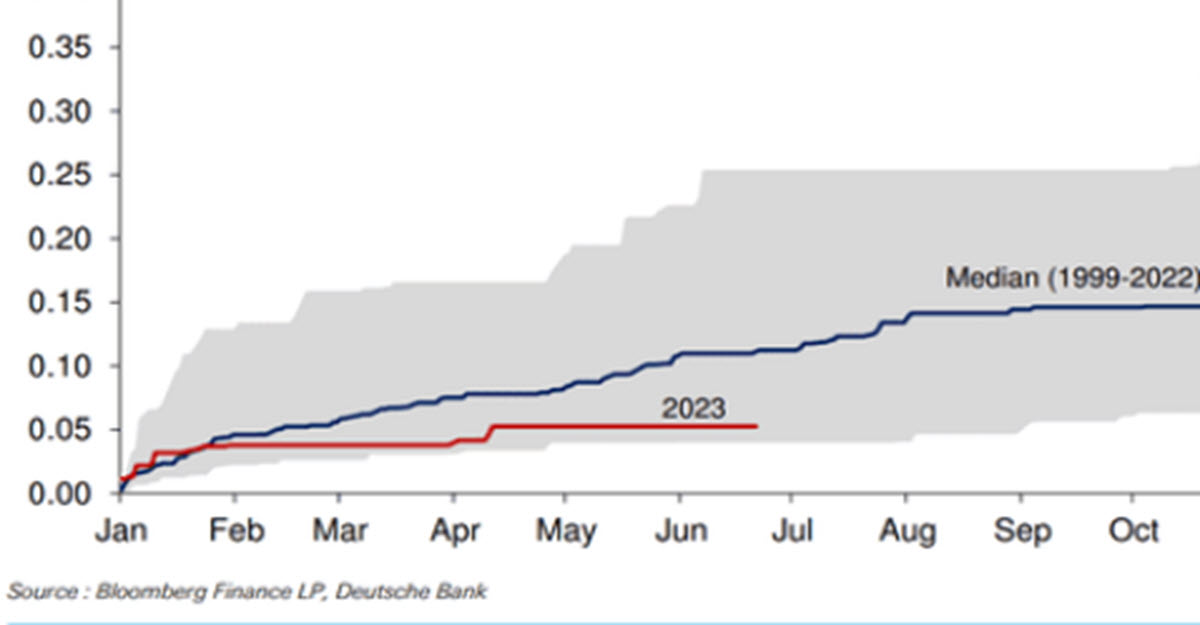
1.0780–1.09 is the area from where in early 2020 the EURUSD found the strength to rise to 1.23 during a 1-year long bull market. Since those highs the downward run has started again: what interests us is that any trendline traceable to define that movement has been broken. The bear market that lasted about 16 months from the highs to the lows (0.955) at the end of September 2022 is definitely over, never mind that the appreciation to current levels has been about 14% (we are talking about currencies here).
Fig 2. EURUSD Daily, 2018 – now
Hence we have a market that after the strong rebound that started in Q3 2022 has slowed down and gone sideways for 6 full months now. At the same time, the movement that supported the USD from 2021 onwards is definitely dead. This has created a difficult situation to decipher over the long term (otherwise we would not be talking about laterality).
There is likely a long-term bullish trendline coming and it’s passing today around 1.0780 which – as a level – can be considered a support; the price is just now above its 50 MA. But something is not quite clear right now: the European economy is showing more signs of weakness than the US one and this is not supportive of a Euro appreciation. What might eventually be seen is the just begun large reduction in the central bank balance sheet (this is a theme of recent days), or a drastic deterioration in the condition of the US economy.
Fig 3. ECB’s balance sheet weekly changes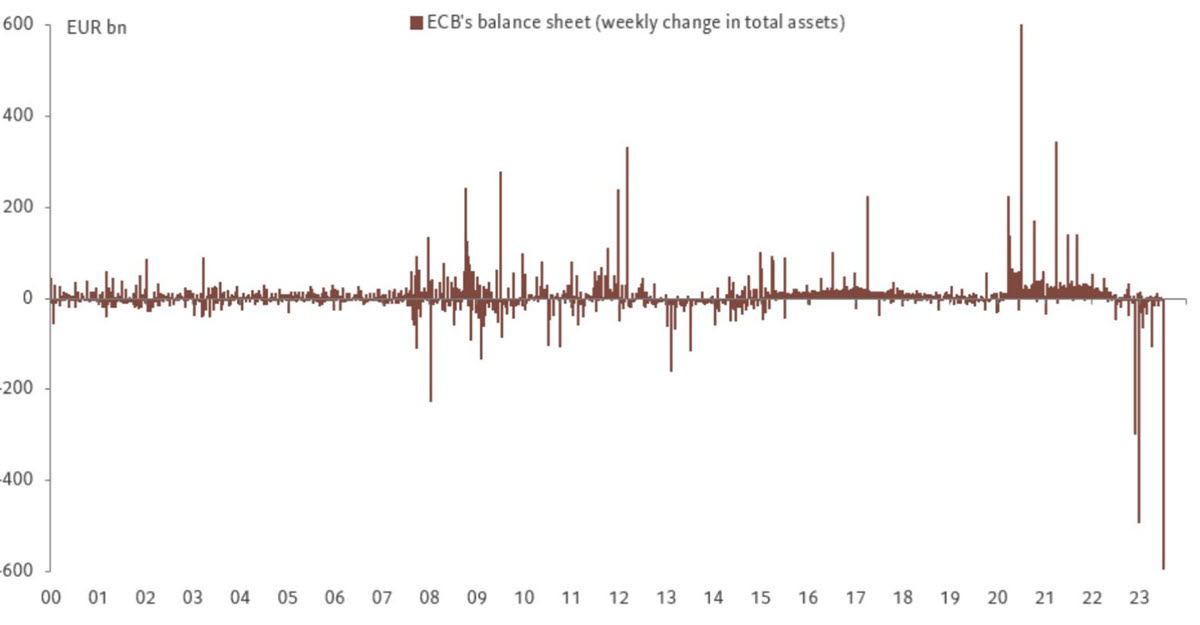
Having said that, in the long term the pair remains faithful to the structure currently in place: a sideways zig zag between 1.105 and 1.05, not forgetting, however, that last time the downward movement stopped at 1.0630 – we will monitor it – and if this were the start of a rising lows structure within the range, this time even 1.0780 could be an important support. To the upside, only a break above 1.11 would unleash the potential for a new long-term upward move.
Fig.4 EURUSD daily, ST
Click here to access our Economic Calendar
Marco Turatti
Market Analyst
Disclaimer: This material is provided as a general marketing communication for information purposes only and does not constitute an independent investment research. Nothing in this communication contains, or should be considered as containing, an investment advice or an investment recommendation or a solicitation for the purpose of buying or selling of any financial instrument. All information provided is gathered from reputable sources and any information containing an indication of past performance is not a guarantee or reliable indicator of future performance. Users acknowledge that any investment in Leveraged Products is characterized by a certain degree of uncertainty and that any investment of this nature involves a high level of risk for which the users are solely responsible and liable. We assume no liability for any loss arising from any investment made based on the information provided in this communication. This communication must not be reproduced or further distributed without our prior written permission.


