


The USDIndex ended last week down -0.15%, but on a weekly basis still rallied +0.57%, easing pressure throughout July. Weaker-than-expected US inflation news on Friday saw T-note yields move lower. Additionally, Yen strength weighed on the Dollar, after the Yen rose to a 1-week high, after the BOJ tweaked its yield curve control program.
US economic data at the end of the week was mostly bearish for the Dollar. June personal income rose +0.3% m/m, weaker than expectations of +0.5% m/m. In addition, the June core PCE deflator fell to +4.1% y/y from +4.6% y/y in May, better than expectations of +4.2% y/y and the slowest pace of increase in over a year. In addition, the Q2 employment cost index rose +1.0% (annualised q/q), slower than expectations of +1.1% and the smallest pace of increase in 2 years. Lastly, the University of Michigan’s US July consumer sentiment was revised lower to 71.6 from the initial report of 72.6. On the positive side, June personal spending rose +0.5% m/m, stronger than expectations of +0.4% m/m.
The Fed’s tightening campaign seems to be coming to an end, as inflation is slowly declining. The focus on Wall Street will now include economic activity in addition to inflation. There will be plenty of economic data in the week ahead; two regional Fed polls on Monday, with manufacturing activity data from the Dallas Fed projected to remain strongly negative but the MNI Chicago PMI expected to improve slightly. The final manufacturing PMI figures, ISM manufacturing report and JOLTS job openings will all be released on Tuesday, making it a packed day. The ADP employment update for Wednesday is projected to slow from a 497k pace to 185k. ISM services survey and initial jobless claims on Thursday. July non-farm payroll data on Friday is the week’s main event.
Technical Review
USDIndex, D1 – The USDIndex settled back above the $100.00 round figure in the last 7 days of trading, after recording a 15-month low price of $99.19. The rebound still looks short-lived, as the overall market is still dominated by bears. Moreover, the current price is still below the 200-day EMA and the MACD is still in the selling zone, although the RSI has crossed the 50-midline. A move to the upside could test the 200-day EMA around $103.00 and 103.25 resistance. While on the downside, the $100.00 round figure is still the fulcrum.
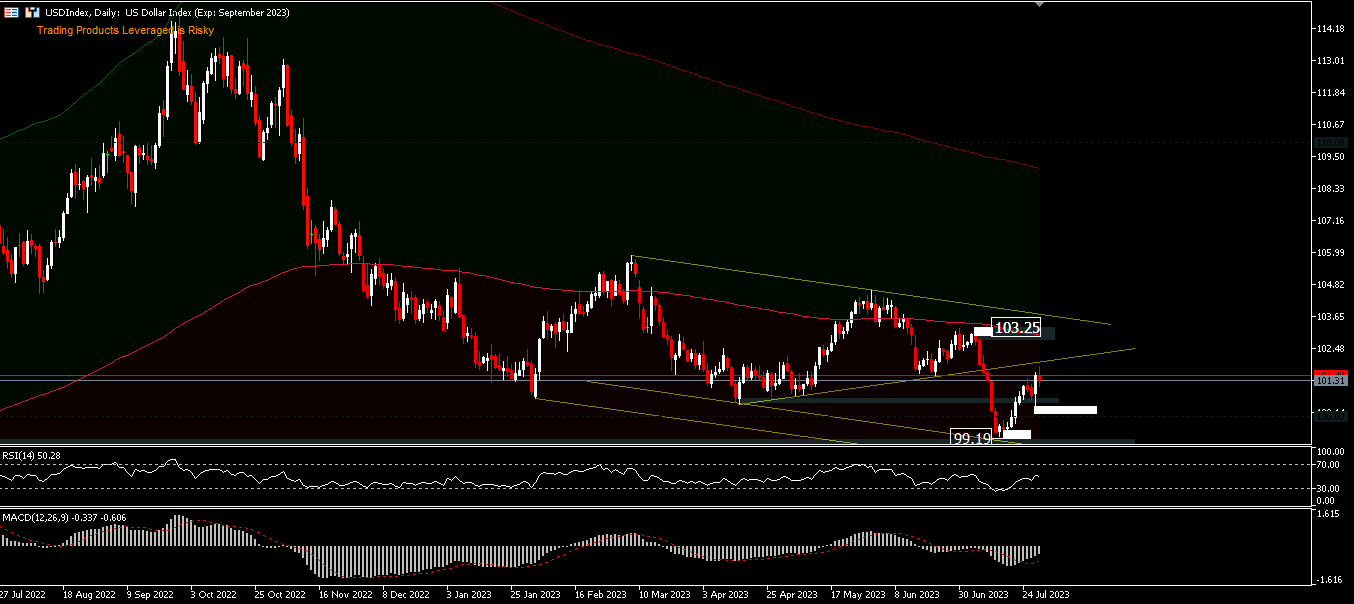
Intraday bias is likely to stabilise, with a possible move above $101.80 intraday resistance which could test $103.25, while a move below $100.29 intraday low would only prove the decline of the $114.71 peak is unfinished and instead open the door to a test of the $99.19 support and lower.
Click here to access our Economic Calendar
Ady Phangestu
Market Analyst – HF Educational Office – Indonesia
Disclaimer: This material is provided as a general marketing communication for information purposes only and does not constitute an independent investment research. Nothing in this communication contains, or should be considered as containing, an investment advice or an investment recommendation or a solicitation for the purpose of buying or selling of any financial instrument. All information provided is gathered from reputable sources and any information containing an indication of past performance is not a guarantee or reliable indicator of future performance. Users acknowledge that any investment in Leveraged Products is characterized by a certain degree of uncertainty and that any investment of this nature involves a high level of risk for which the users are solely responsible and liable. We assume no liability for any loss arising from any investment made based on the information provided in this communication. This communication must not be reproduced or further distributed without our prior written permission.


