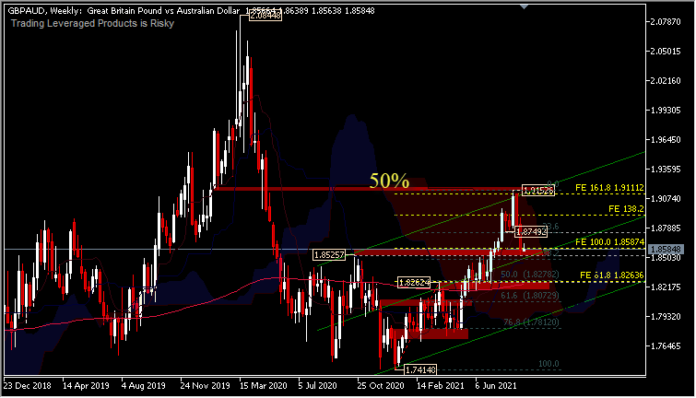
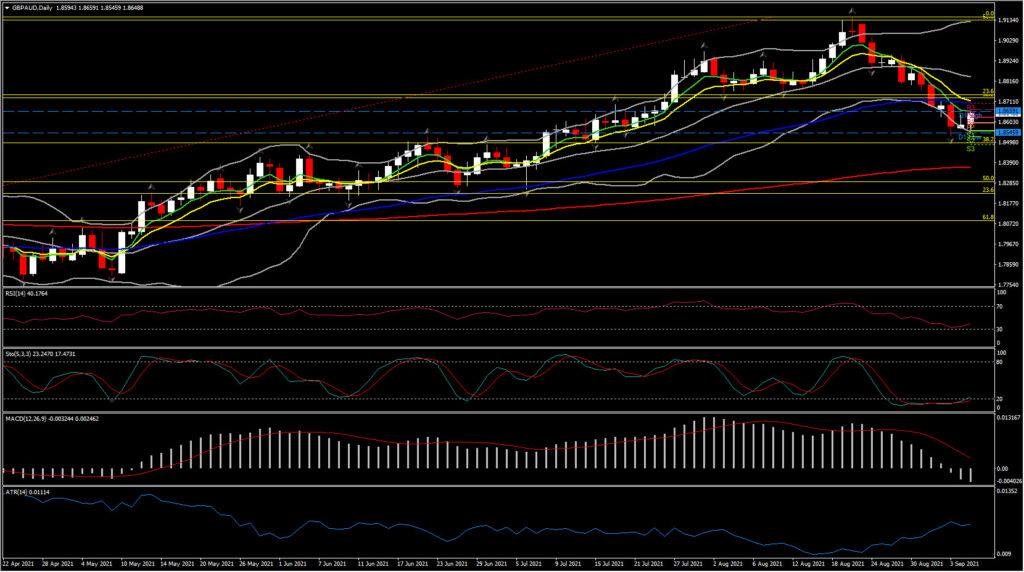
Mientras tanto, GBPAUD ha caído desde un máximo de 1.9152 el 20 de agosto a 1.8530, pasando por debajo del nivel de Fibonacci del 38.2% visto en la etapa descendente de 2020. Una caída adicional podría volver a probar 1.8262 (nivel de Fibonacci del 50.0% del rally de 8 meses) con soporte inmediato en 1.8500 y 1.8370 (EMA de 200 días). Los indicadores de impulso cumplen con la caída que sugiere un cambio a una perspectiva negativa para el activo. El RSI está en 40, aún manteniendo un movimiento por encima de una condición de sobreventa, mientras que las líneas del MACD se volvieron negativas, con la línea de señal por encima de 0. Esto implica una posible consolidación en el corto plazo, mientras que si el activo encuentra un equilibrio en 1.8500, una corrección podría vuelva a probar 1.8755 y 1.8900.
Click here to access our Economic Calendar
Andria Pichidi
Disclaimer: This material is provided as a general marketing communication for information purposes only and does not constitute an independent investment research. Nothing in this communication contains, or should be considered as containing, an investment advice or an investment recommendation or a solicitation for the purpose of buying or selling of any financial instrument. All information provided is gathered from reputable sources and any information containing an indication of past performance is not a guarantee or reliable indicator of future performance. Users acknowledge that any investment in Leveraged Products is characterized by a certain degree of uncertainty and that any investment of this nature involves a high level of risk for which the users are solely responsible and liable. We assume no liability for any loss arising from any investment made based on the information provided in this communication. This communication must not be reproduced or further distributed without our prior written permission.


