


This week will be an exciting week for earning season as Microsoft (MSTF), the one of three members of the Trillion Dollar Club (also known as 4-comma club) will release its Q1 result on 27th July 2020 after hours. In 2020 Quarter 4 reports late in July, Microsoft reported the results that beat Wall Street and profit expectation as lockdown boosted the revenue up to $38 billion (13% increase y/y) and earnings per share $1.46.
In general, Microsoft Corp. (MSFT) stock has outperformed S&P 500 in 2020, rising more than 30% year to date. Covid-19 has been a blessing in disguise for Microsoft as the pandemic caused millions of clients working remote from home and the subscription demand for Azure, Microsoft’s Intelligent Cloud business remain steady. Microsoft’s cloud computing business has seen incredible growth in the past few years, nearly doubling its quarterly sales since 2017.
For Q1 FY 2021, Most analyst predicts that the company will see the steady improvements of revenue as they expecting Intelligent Cloud revenue to post strong gains, but significantly slower than the same period year-over-year (YOY). Microsoft Corp. will publish fiscal year Q1 2021 financial results after the close of the market on Tuesday, October 27, 2020. The tech-giant expected to report adjusted earnings per share of $1.54 (prior-year quarter = $1.38). Revenue is projected at ~$35.7 billion, up from $33.05 billion a year ago.
Shares of Microsoft were trading at $209.41 as of market close October 26. Over a 12-month period, shares are up more than 50%. Given that the historical returns are generally positive, long-term investor should be satisfied going into this earnings release. Both Zacks and Thestreet rate the MSTF stock a BUY call. The polled analysts offering 12-month price forecasts for MSTF have a median target of $241.50, with a high estimate of $260.00 and a low estimate of $208.00. The median estimate represents a +15.32 % increase from the last price of 209.41 (Source: CNN Money)
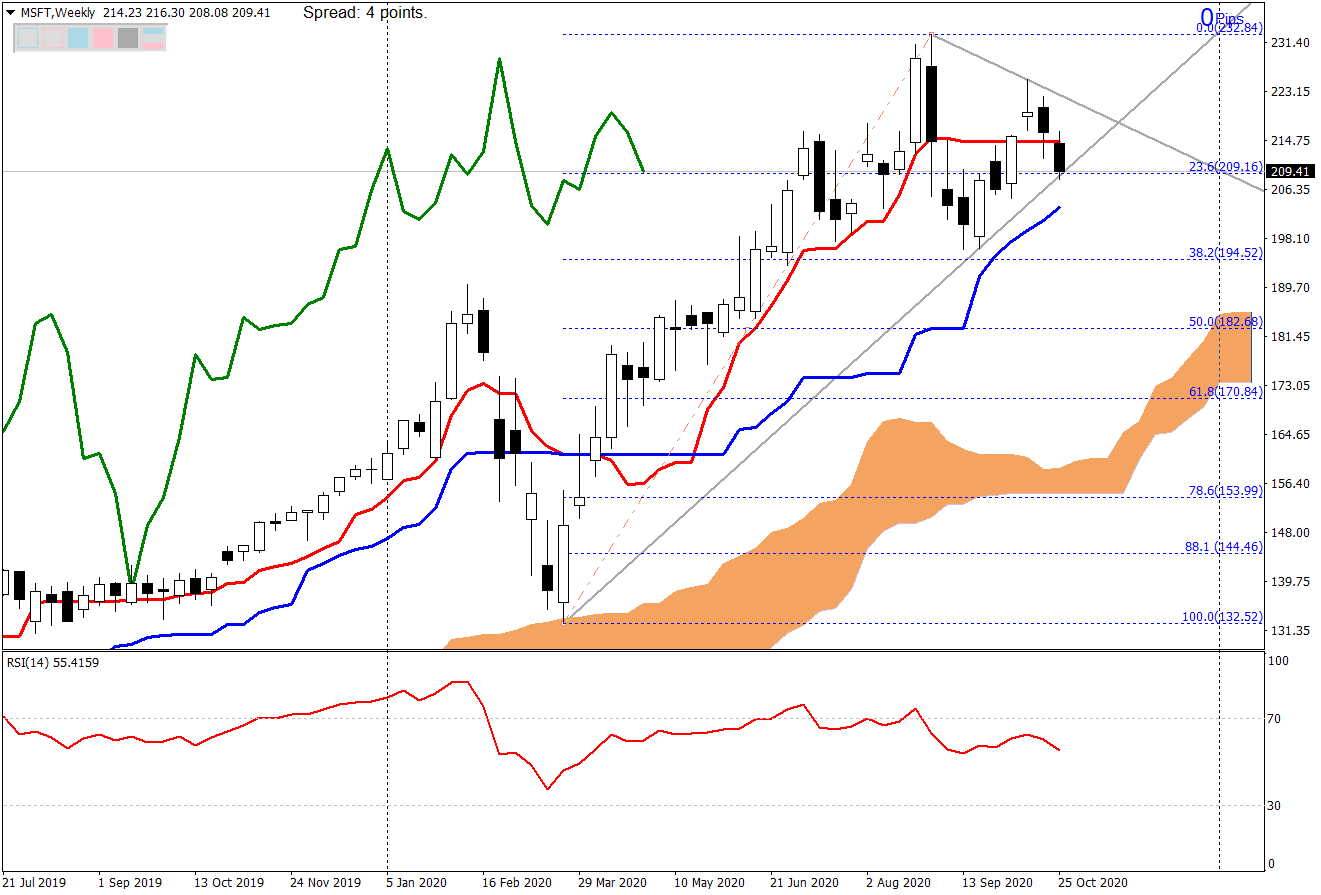
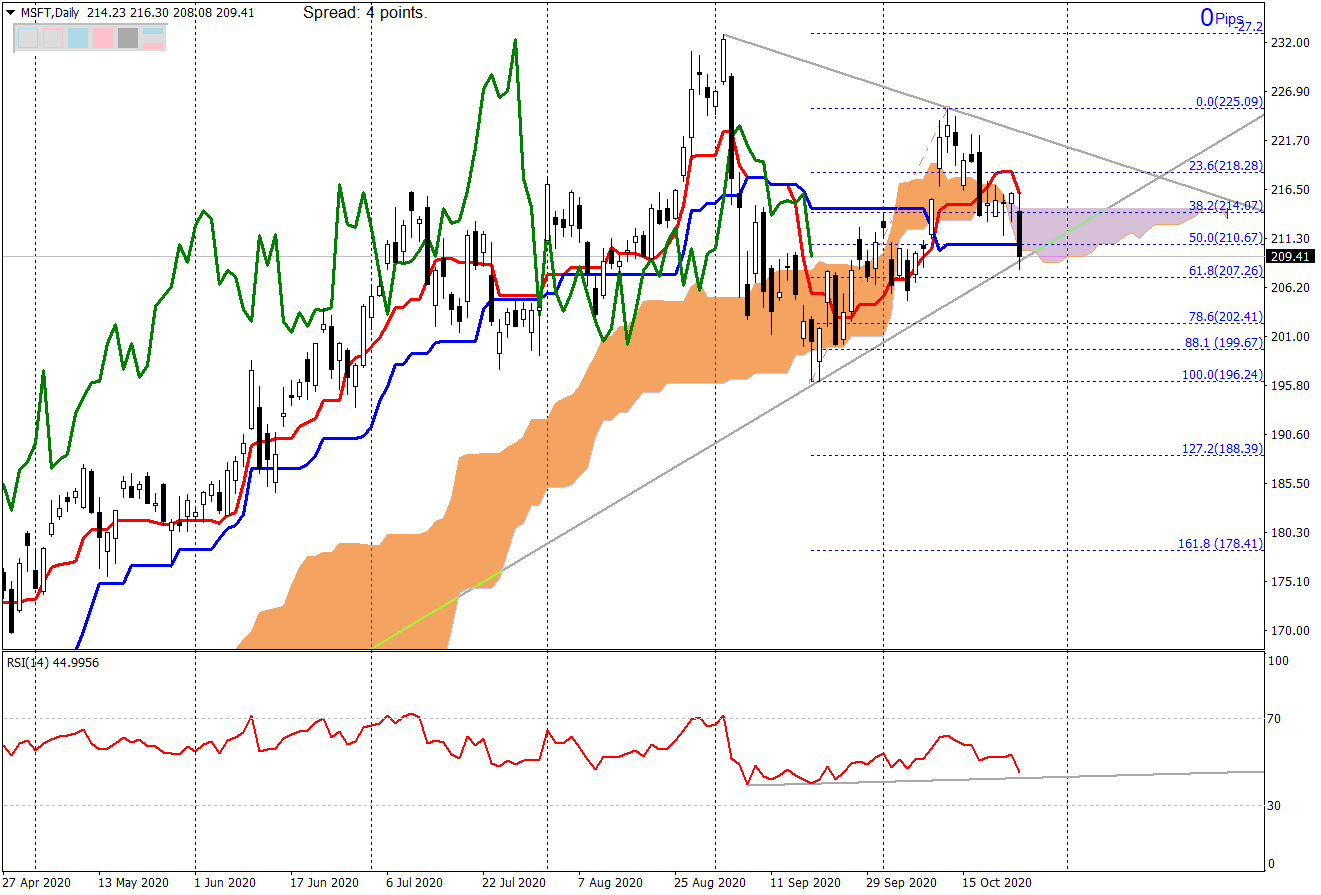
It has been a bullish year for Microsoft (MT5 symbol: #Microsoft), its price reached the all-time high at $232.84 on August 30 and then slightly declined and currently traded at 209.41. Weekly chart showed that this week price is open below the Tenkan-sen line and Monday close is near to 23.6% Fibonacci retracement. Up-Kumo still expanding and showing upward momentum. For the Daily chart, MSTF price currently traded below the Kijun-sen line and Span-B cloud. It tested the uptrend trendline. The RSI-14 value is currently lower than 50.
Click here to access the Economic Calendar
Tunku Ishak Al-Irsyad
Market Analyst
HF Education Office Malaysia
Disclaimer: This material is provided as a general marketing communication for information purposes only and does not constitute an independent investment research. Nothing in this communication contains, or should be considered as containing, an investment advice or an investment recommendation or a solicitation for the purpose of buying or selling of any financial instrument. All information provided is gathered from reputable sources and any information containing an indication of past performance is not a guarantee or reliable indicator of future performance. Users acknowledge that any investment in Leveraged Products is characterized by a certain degree of uncertainty and that any investment of this nature involves a high level of risk for which the users are solely responsible and liable. We assume no liability for any loss arising from any investment made based on the information provided in this communication. This communication must not be reproduced or further distributed without our prior written permission.


