As you might have already noticed, we have seen a very strong rally in Oil prices so far today, which has catalysed a strong bid for the Canadian Dollar as well. The WTI crude prices are up by nearly 3% since the Fed’s announcement, and are up by 7% from week-ago levels. Additionally, the move came also on the news that Iran’s shoot down a US drone in the Persian Gulf. Roughly one fifth of global oil production travels through the Strait of Hormuz, which Iran has previously threatened to close should hostilities arise. Hence these along with the dovish Fed, a lower Dollar, and with a US crude inventory build, reported on Wednesday, have supported Oil prices.
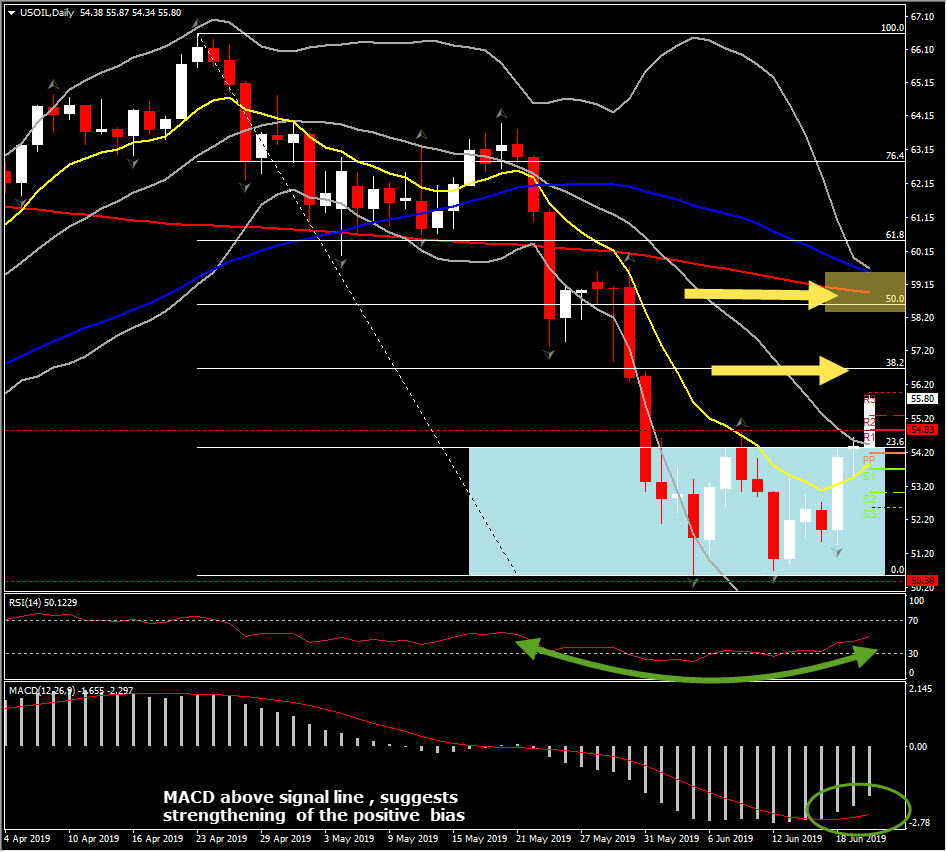
However what triggers our attention is the fact that the energy managed to enter the upper Bollinger Bands pattern, to break the 2-week range, and therefore to fly far away from the 200-day SMA at $52.70 and the 5-month Support level at $50.38.
All the above, along with a closing today close to day’s highs, could satisfy our statement from last week and therefore would turn USOIL’s outlook into a positive one in the medium term:
Yesterday’s high at $54.43 is the immediate Resistance for the asset. However the Key Resistance and Support levels for USOIL are $54.80 and its 2-week low at $50.15 respectively. A break below the latter could open the doors towards 2018 lows, while a break above Resistance could retest the 38.2% Fibonacci retracement at $56.60 and the round $57.00 level.”
Therefore today’s buying the deep behaviour by market participants, which formed the decisive rally above $55 level and the 23% Fib. retracement set on year’s peak, suggests the retest in the near term of the 38.2% Fib. level and the round $57.00 level. Additionally, it opens the doors towards a 50% recovery from April decline, at $58.50-$59.00 area, as theoutlook is looking ready to switch into a bullish one.
Technicals provide extra confirmation of the increasing bullish bias, as MACD lines are strengthening above signal line, while RSI slopes positively above 50 area after it formed a Rounding bottom.
Intraday, momentum looks still strong despite the overbought price action that we have identified, on the breach of upper Bollinger band line. A small correction on today’s rally might find immediate Support at $55.35 or $54.85 levels, before an attempt higher again.
Click here to access the Economic Calendar
Andria Pichidi
Market Analyst
Disclaimer: This material is provided as a general marketing communication for information purposes only and does not constitute an independent investment research. Nothing in this communication contains, or should be considered as containing, an investment advice or an investment recommendation or a solicitation for the purpose of buying or selling of any financial instrument. All information provided is gathered from reputable sources and any information containing an indication of past performance is not a guarantee or reliable indicator of future performance. Users acknowledge that any investment in Leveraged Products is characterized by a certain degree of uncertainty and that any investment of this nature involves a high level of risk for which the users are solely responsible and liable. We assume no liability for any loss arising from any investment made based on the information provided in this communication. This communication must not be reproduced or further distributed without our prior written permission.


