


")
In anticipation of the US Q3 GDP results, this post elaborates on what this measure of economic growth actually means and how it has affected currency markets in the past.
GDP stands for Gross Domestic Product, which measures the value of all goods and services produced in a country during a specific period of time. Given that the value of all these goods and services is measured through their market prices, GDP can also be viewed as a measure of total expenditure in the economy. Furthermore, since expenditure means essentially that goods are exchanged with money, then GDP can also be viewed as a measure of income received for the production of goods. As such, GDP has the triple ability to serve as a proxy for production, expenditure, and income. In addition, as it encapsulates the whole of economic sectors, it provides us with an informed view on the total performance of the economy.
To calculate GDP we need to sum its four constituents: private sector consumption, government consumption, investment, and net exports (exports minus imports). The first two are straightforward as they basically measure the amount of money spent by each of the two sectors of the economy. Distinguishing between them is important because investors and economic observers need to observe how much of GDP can be attributed to each. The reason is that GDP growth fueled by increases in government spending can only be sustainable for only for some time, as government debt and deficit will increase and make its repayment much more difficult, unless the private sector picks up and starts consuming again. The reason that investment is important is also straightforward given that it shows the potential of the economy in the longer term. The more investment in the economy the more trust exists in its future prospects as investment projects may be used to produce various consumer goods and services. Nonetheless, given that the nature of investment is volatile, large ups and down can occasionally be observed and is the category most affected by recessions (red line).
Net exports (exports minus imports) essentially measure the extent of international trade and how this has affected the country over the period under study. For example, if imports are higher than exports then it means that the country has consumed more than it has produced. This suggests that it spends more money than it receives from abroad and this can harm its currency prospects, as elaborated here. However, higher imports mean higher consumption which also suggests that the economy is growing. In essence, deducting the amount of imports allows us to separate between the total production which was domestically produced and consumed from the consumption of imported goods. The same holds for exports which allow us to measure total domestic production and not the one just consumed within the country.
The major difficulty with interpreting GDP results has to do with prices. If inflation increases by 2% annually but production does not increase, then GDP will register a 2% fictional increase. To this end, economists and investors have been using real GDP which accounts for the change in inflation. As such, examining real GDP (including real private consumption, real government consumption and real investment) provides a better understanding of the economic fundamentals of the economy.
Real GDP results are usually assessed at a y/y growth rate or a q/q growth rate if they are seasonally adjusted. Both have their merits: a y/y growth rate allows for an overview as to how the economy is doing compared to last year, while a q/q rate allows us to observe the short-term trend in the economy. Naturally, there have been times where positive y/y growth and negative q/q growth is observed, suggesting either a large one-off event in the previous quarter or the beginning of a slowdown. In the opposite case (negative y/y growth and positive q/q) one could expect either the beginning of a recovery period or the base effect from a better than expected quarter last year. In most cases though, q/q and y/y growth rates have the same sign. Other than these growth rates, the US specifically reports annualised growth rates which suggest what the growth rate for the whole year would have been if the same quarterly growth persisted. This is a rather fictional number, only useful when compared to past releases of itself and not to any other growth rate.
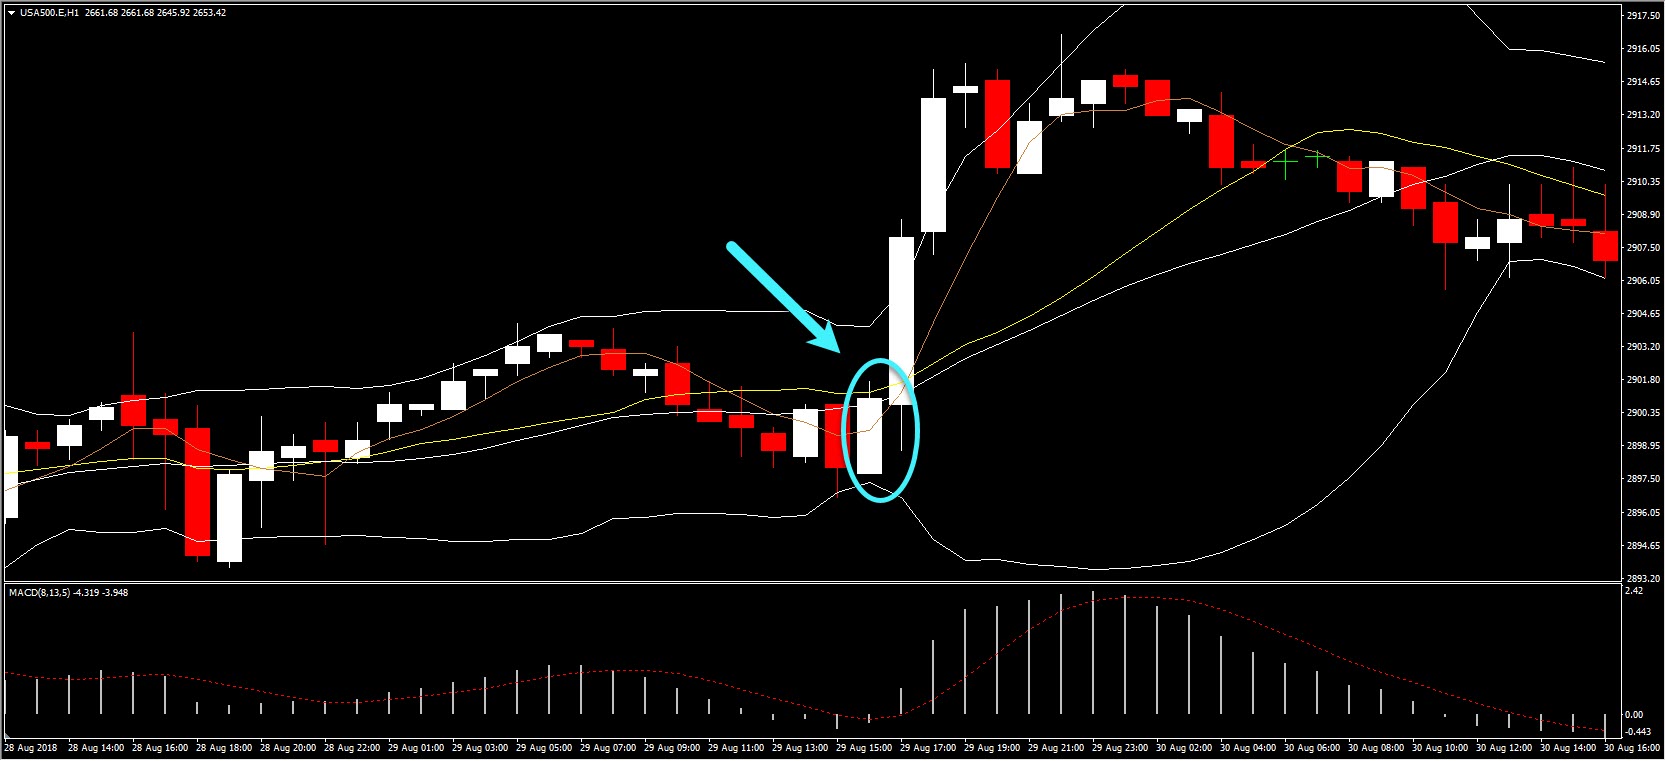
In an example of what happens during unexpected positive real GDP data releases, on August 29, 2018 12:30 GMT, US real GDP came out at 4.2% (annualised) compared to expectations for 4%. A positive reading for the US economy did not have a large effect on the currency but it did push the stock market up 3 points at the time of announcement and led to a three-hour surge in the index value, with a total gain of 16 points.
Click here to access the HotForex Economic calendar.
Want to learn to trade and analyse the markets? Join our webinars and get analysis and trading ideas combined with better understanding on how markets work. Click HERE to register for FREE! The next webinar will start in:
[ujicountdown id=”Next Webinar” expire=”2018/10/30 14:00″ hide=”true” url=”” subscr=”” recurring=”” rectype=”second” repeats=””]
Dr Nektarios Michail
Market Analyst
HotForex
Disclaimer: This material is provided as a general marketing communication for information purposes only and does not constitute an independent investment research. Nothing in this communication contains, or should be considered as containing, an investment advice or an investment recommendation or a solicitation for the purpose of buying or selling of any financial instrument. All information provided is gathered from reputable sources and any information containing an indication of past performance is not a guarantee or reliable indicator of future performance. Users acknowledge that any investment in FX and CFDs products is characterized by a certain degree of uncertainty and that any investment of this nature involves a high level of risk for which the users are solely responsible and liable. We assume no liability for any loss arising from any investment made based on the information provided in this communication. This communication must not be reproduced or further distributed without our prior written permission.


