


GER30, D1
Last time we visited the Elliott Wave Theory (EWT), it suggested the presence of phase (v) in the first motive wave. Since then, it appears that the USA30 has still not moved over the 26149 Resistance level and hence phase (v) appears to continue. Today, we will deal with another index, namely GER30, which is also a good opportunity for study. In our analysis we employ daily data, which usually means that we are assessing the longer-term trend of the index. Still, the benefit of EWT is that it can be employed for higher frequencies hence there is practically no limit to its use.
To begin our analysis, we first need to identify in which Wave and phase we are located. To this end, have a look at the figure below. Suppose that we interpreted the start of our sample as Wave 1. Remember that EWT stipulates that markets move in a 5-wave sequence, of which the second and fourth move against the long-term trend (correction wave). In other words, if the overall trend is upwards, the second and fourth wave will be moving downwards and vice versa. Within the waves themselves, there is a smaller 5-wave movement in Waves 1, 3, and 5, while a 3-wave movement is observed for waves 2 and 4. Following this, we have identified that the Waves moved as indicated in the circles below. Is this correct?
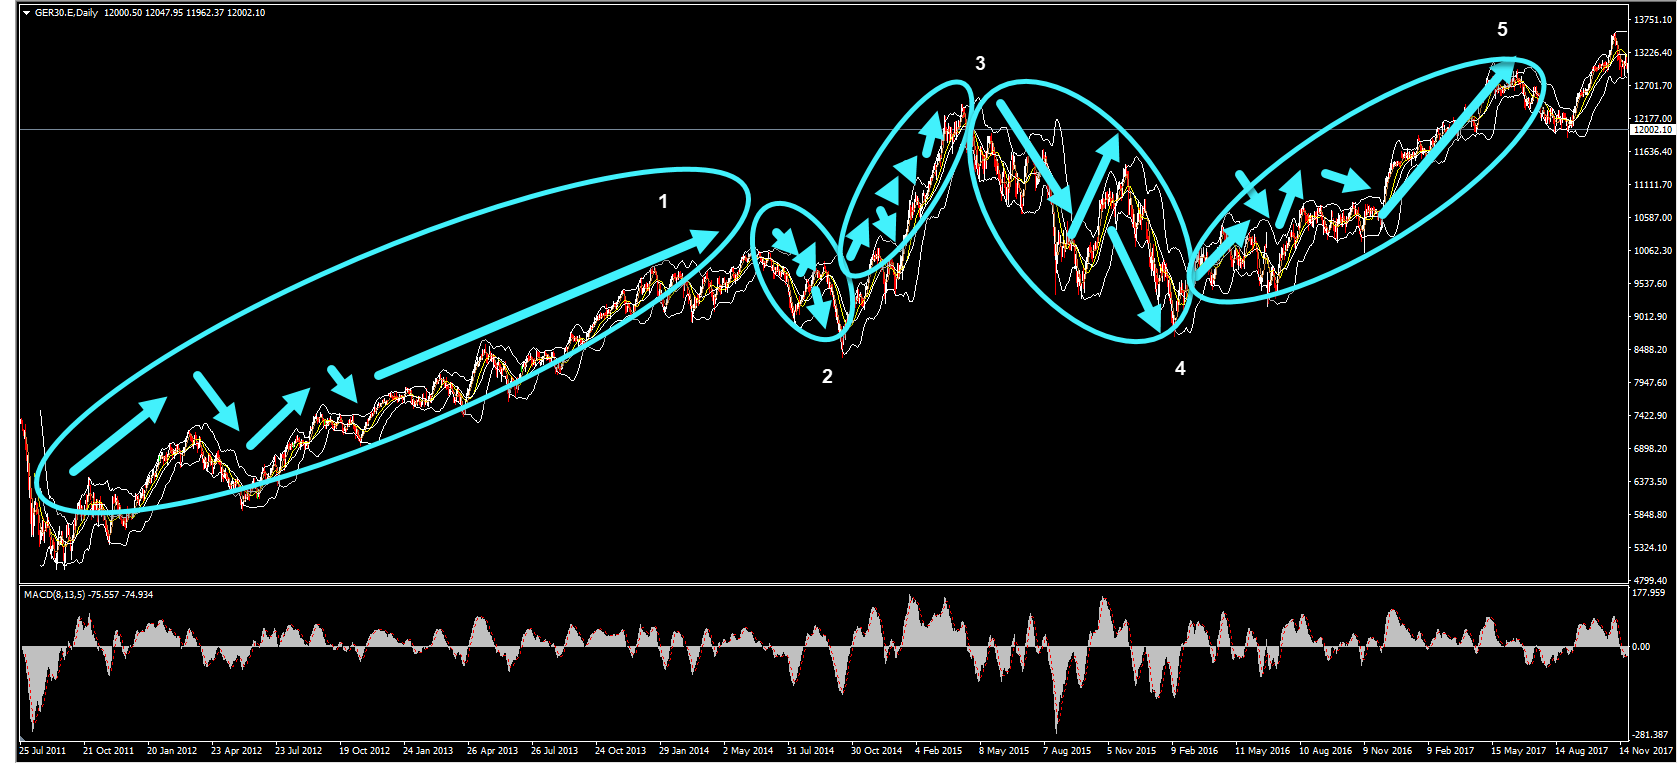
Let’s examine for validity: can Wave 1 be the longest wave? In theory, yes albeit this is not very common. Can Wave 3 be the shortest though? That does not really abide with EWT. Furthermore, Wave 4 appears to overlap with Wave 1’s territory, another sign that our analysis does not abide by the EWT rules. Let’s try to reassess the Waves now. As we have seen, the longest wave cannot be classified as Wave 1, and it is too long to be a correction wave so it’s either Wave 3 or 5. However, if it was classified as Wave 5, i.e. the end-wave of the series, the following corrective waves would have to end up lower and not higher than that. Hence, it can only be classified as Wave 3. The figure below presents how the waves would evolve.
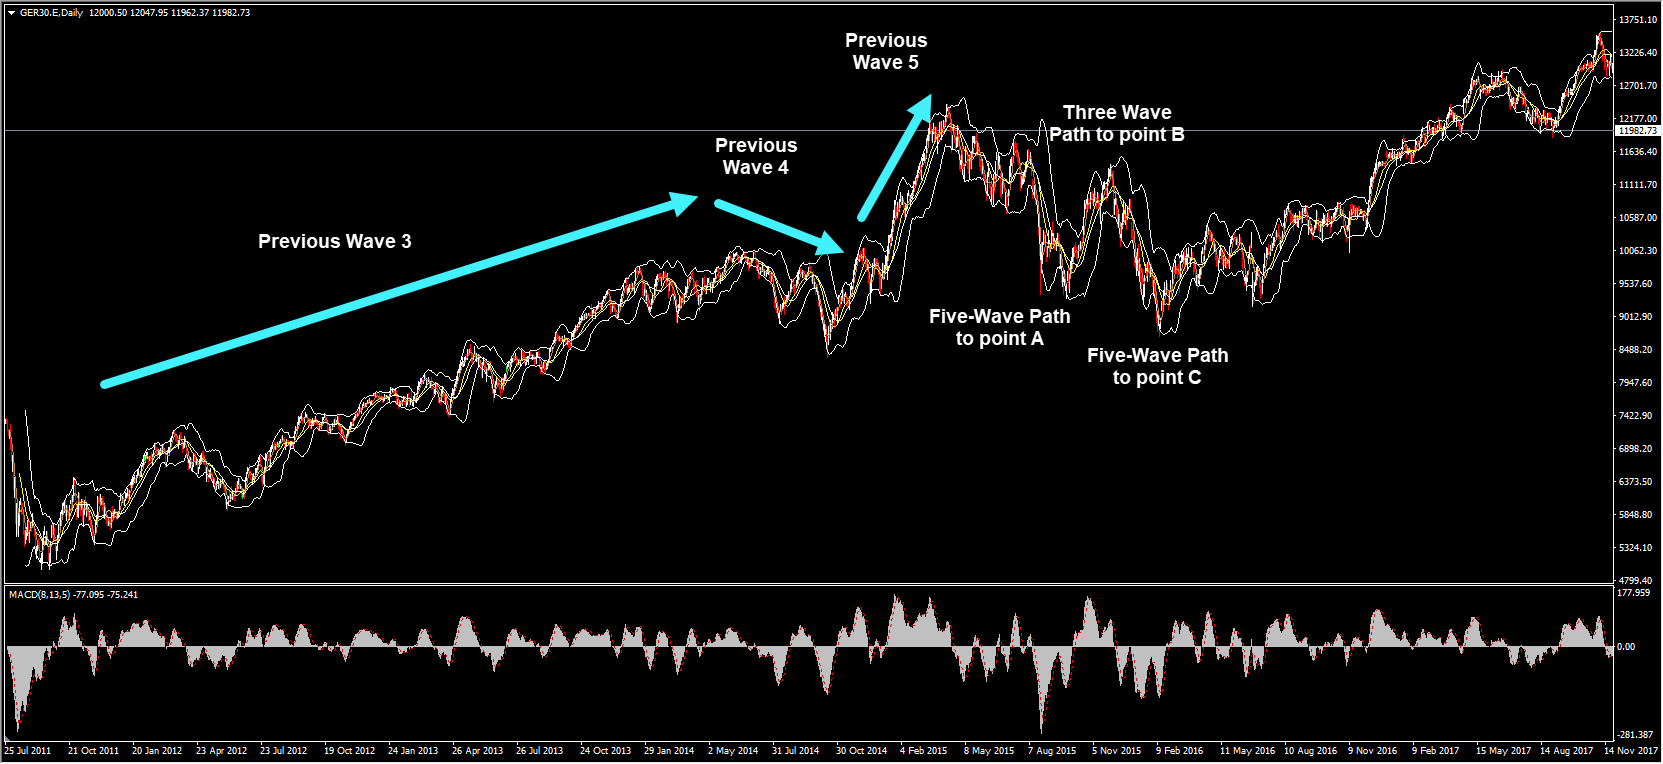
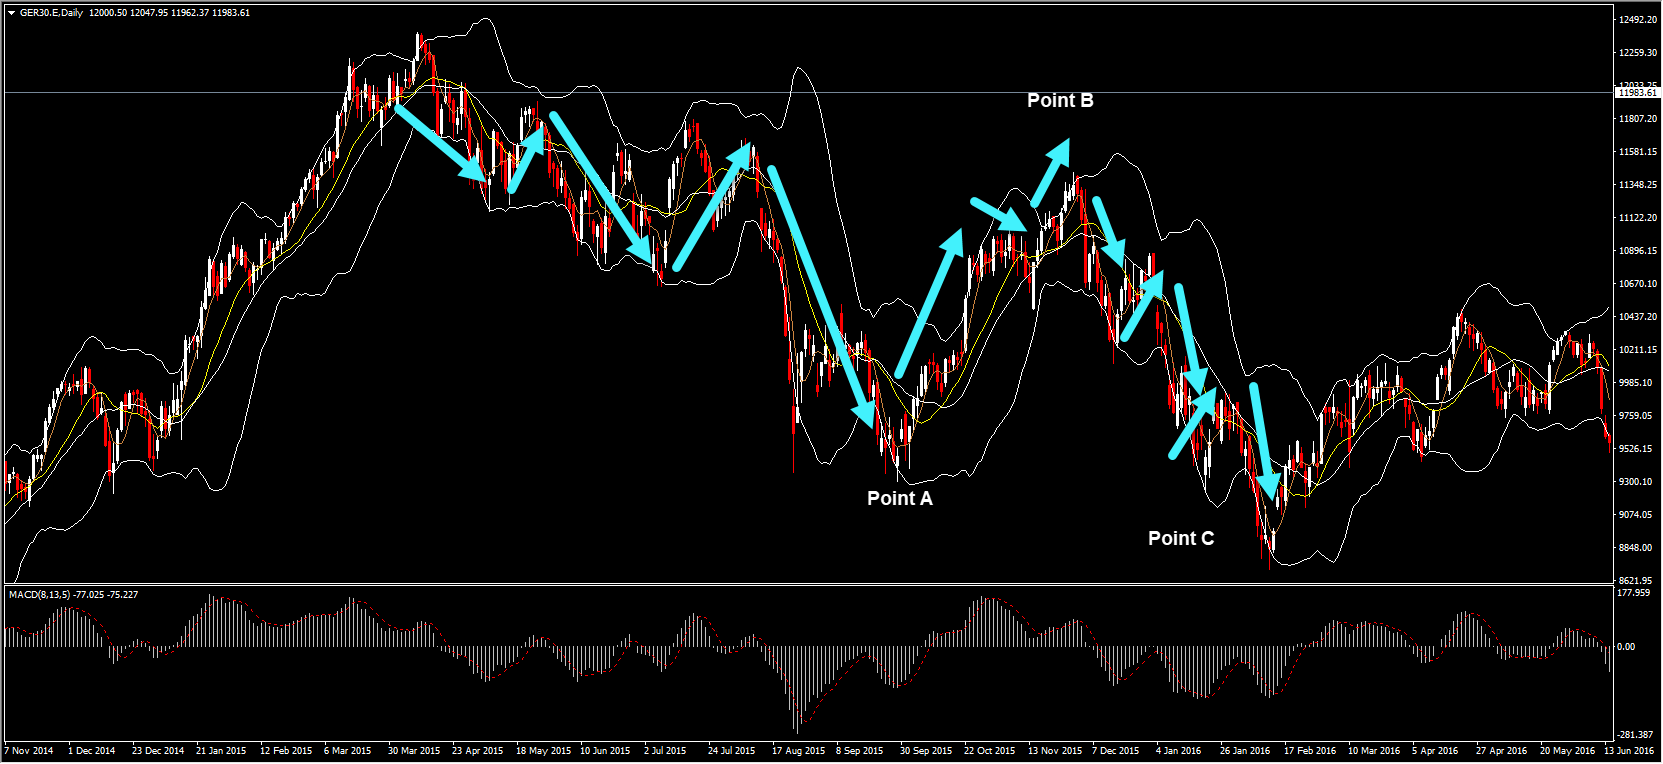
Note that each subsequent wave follows the EWT specified path. A three-wave move following the end of Wave 3 leads to the end of Wave 4, while a five-wave move is indicative of the end of Wave 5. As predicted by EWT, the end of the 5-wave movement should be followed by three corrective waves. These waves, classified as A, B, and C, should either contain 5-3-5 smaller waves (Zigzag formation) respectively, with 3-3-5 (Flat formation) and 3-3-3-3-3 (Triangle formation) also being possible. After zooming into the picture, the corrective waves appear to follow a Zigzag formation, as the figure below tells us.
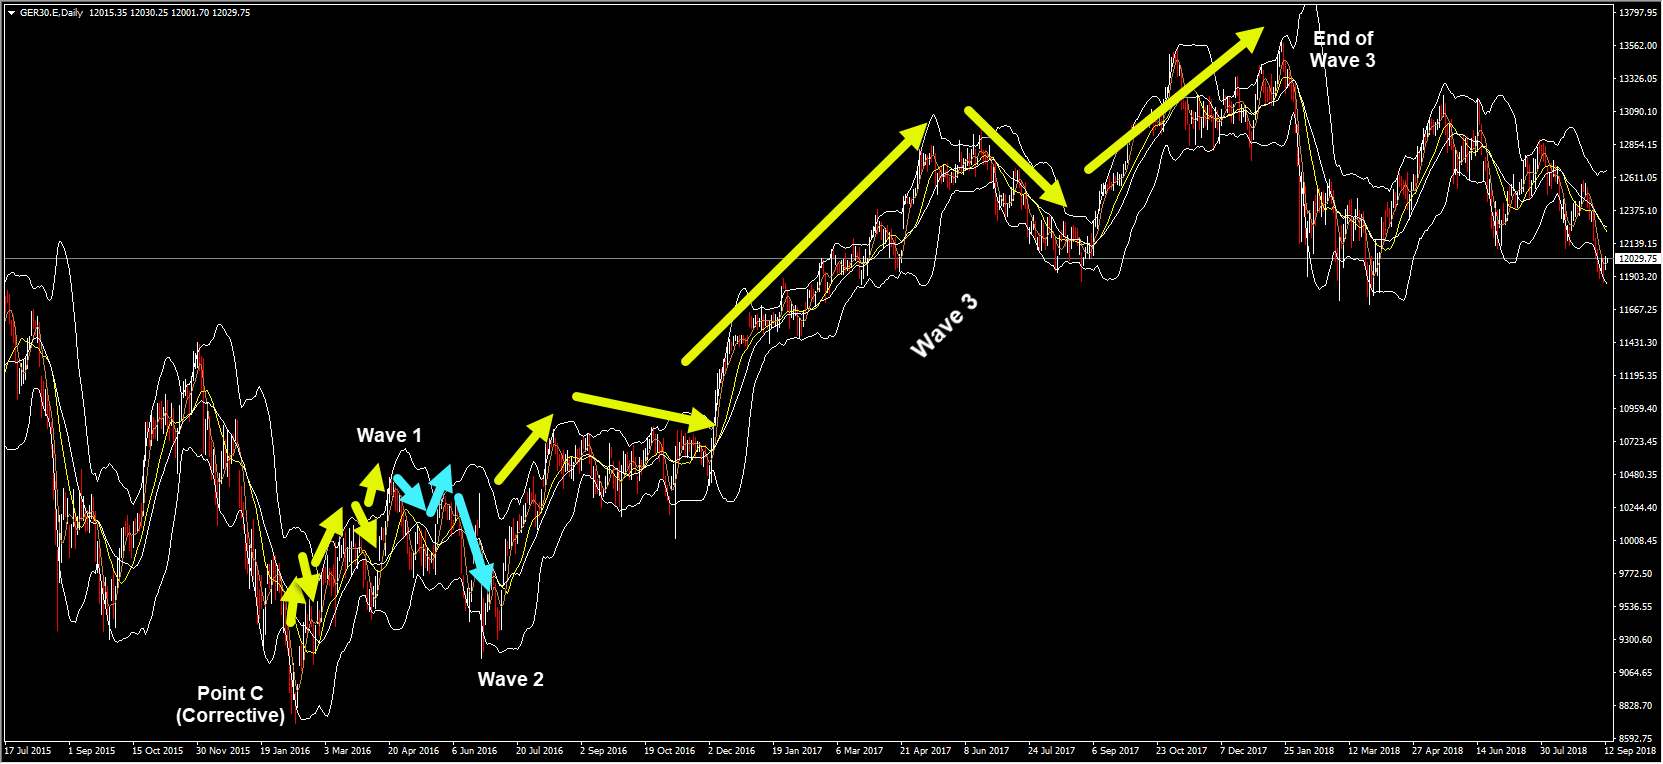
The end of the corrective wave phase usually leads to new waves, which again have smaller 5-3-5-3-5 waves nested within them. The figure below illustrates just that, with yellow arrows indicating Waves 1 and 3 and the turquoise arrows suggesting Wave 2. The end of Wave 3 appears to have been in late-January 2018, following which, we should expect a downwards Wave 4, which should nest 3 smaller waves. Note that the Waves suggested abide by EWT rules given that Wave 2 does not retract more than the beginning of Wave 1, while Wave 3 is definitely longer than Wave 1.
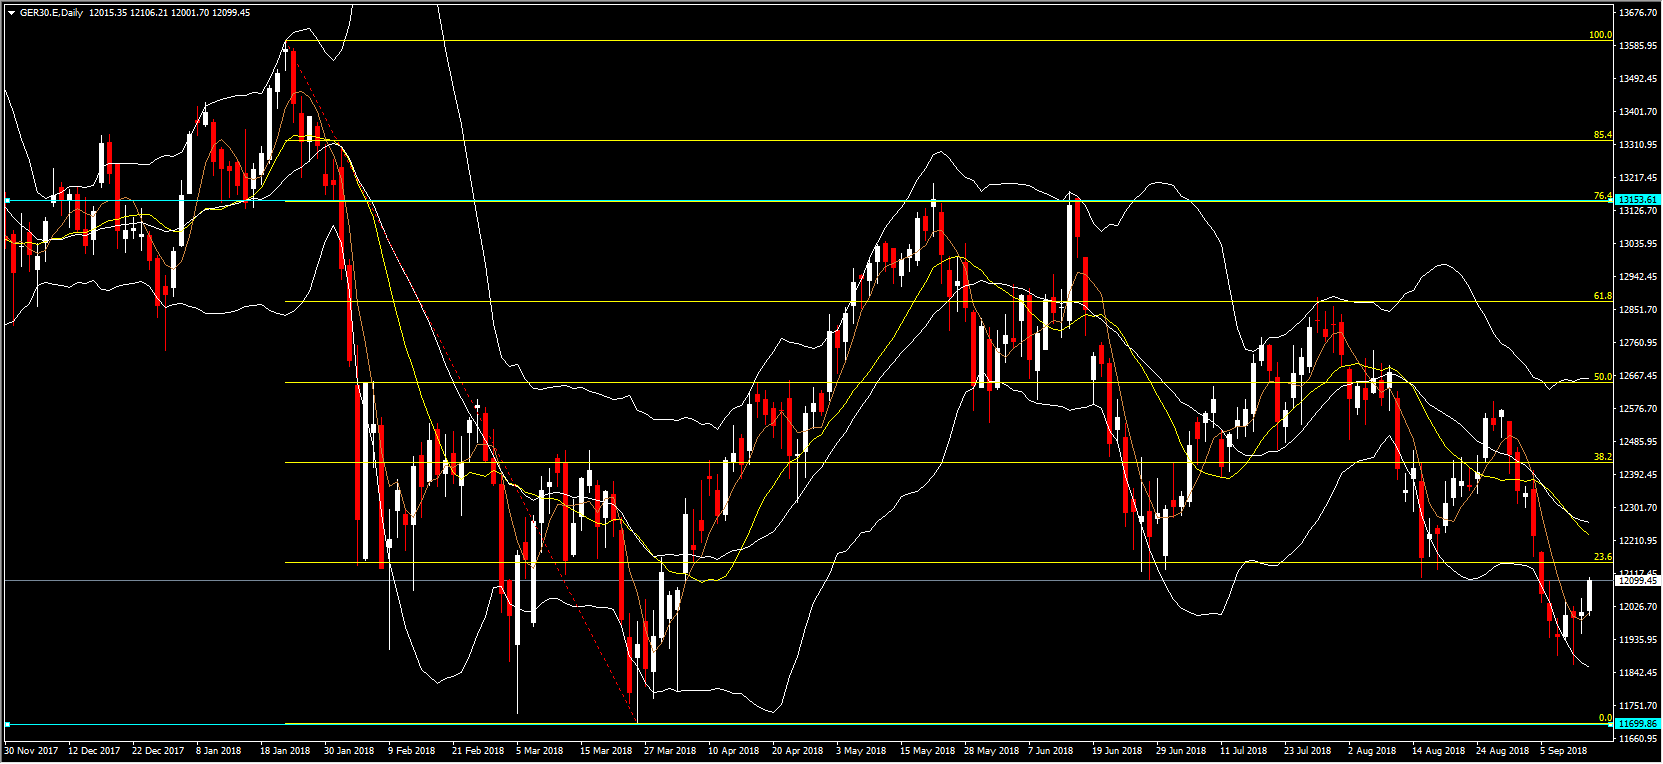
The end of Wave 3 suggests that a downwards adjustment should come next, however, one that should not overlap with the price territory of wave 1. The starting figure in this post shows just that, with a 3-wave movement indicating Wave 4. As EWT then suggests, a positive Wave 5 should be next in sequence. As such, there appears to be a Wave 5 formation which is currently at its second nested wave. Nonetheless, given that this phase is not yet over, we need to identify the Support and Resistance levels. In particular, given that Wave 5 cannot really move past Wave 3, we have set the lowest limit at 11699. If the index breaks this support level then we may have to reassess our definitions regarding the waves. If we are correct, then we would have clear signals of a Wave 5 formation if it breaks the 13153 level, which coincides with the Fibonacci 76.4% level. The 76.4% level also abides by the EWT rules. Until then, we have also associated four more resistance levels, at Fib. 23.6% (12149), 38.2% (12426), 50% (12648) and 61.8% (12873). Remember that Resistance levels become support levels once they have been surpassed and hence movement within the next level is to be expected. As always, bear in mind that “the market can remain irrational longer than you can remain solvent”. In this case, in order to confirm that a Wave 5 formation is present we may need to wait for a while. Hence proper risk management strategies are, and should be, always part of any trading strategy.
Click here to access the HotForex Economic calendar.
Want to learn to trade and analyse the markets? Join our webinars and get analysis and trading ideas combined with better understanding on how markets work. Click HERE to register for FREE! The next webinar will start in:
[ujicountdown id=”Next Webinar” expire=”2018/09/12 15:00″ hide=”true” url=”” subscr=”” recurring=”” rectype=”second” repeats=””]
Dr Nektarios Michail
Market Analyst
HotForex
Disclaimer: This material is provided as a general marketing communication for information purposes only and does not constitute an independent investment research. Nothing in this communication contains, or should be considered as containing, an investment advice or an investment recommendation or a solicitation for the purpose of buying or selling of any financial instrument. All information provided is gathered from reputable sources and any information containing an indication of past performance is not a guarantee or reliable indicator of future performance. Users acknowledge that any investment in FX and CFDs products is characterized by a certain degree of uncertainty and that any investment of this nature involves a high level of risk for which the users are solely responsible and liable. We assume no liability for any loss arising from any investment made based on the information provided in this communication. This communication must not be reproduced or further distributed without our prior written permission.


