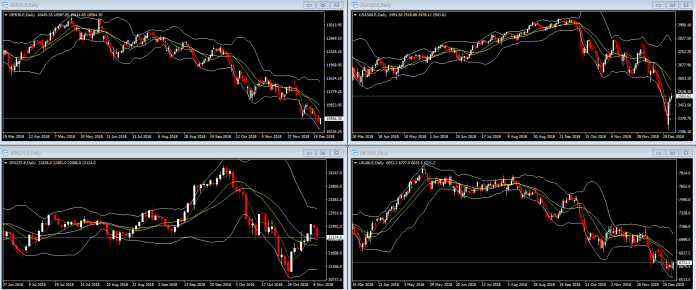
Anyone remotely related to the stock market can easily tell you that the year is not ending on a positive note for the world’s bourses: In Germany the GER30 is currently trading at -19.6% from its peak, the USA500 is at -14.5%, approximately the same as the UK100, while the JPN225 is trading at about -9.5% from its top. While the deviations are large, this is the good news; in the absence of the last couple of days’ rally deviations would have been close to 20% for the majority of the stock markets (excluding Germany), dangerously flirting with bear territory.
The downtrend observed since at least late September begs the question of whether the stock market has declined substantially enough for stocks to become attractive buying targets. Naturally, buyers exist at any price level, however, there are times when buyers significantly outnumber sellers, namely when they feel that valuations have hit rock bottom and there is no other way than up.
A way to assess whether stocks have reached a bottom is by examining their Price over Earnings (PE) ratio. In essence, the ratio tells us how much time it would take for the stock to pay you back all the money you have spent to purchase it. While there is no widely accepted benchmark, anything above or below its long-term average level can be viewed as a potential sign for selling or buying respectively. At this point in time, the estimated PE ratio for the USA500 stands at approximately 19, still above its long term average of 15.7, but below the average of the last 38 years (i.e. since 1980), which stands at 21.2.
A similar metric, the Shiller PE ratio, which uses the 10-year average of profits to calculate the ratio, points to the same direction. Currently, the Shiller PE ratio stands at 27.5, compared to a long term average of 16.6 and a 38-year average of 25.9, thus it would suggest that the market is more or less close to its average.
Thus the USA500 is probably reflecting the situation in the rest of the US economy, which is sending mixed signals to investors. Against a background of uncertainty, data releases appear to indicate in both directions, as positive holiday sales growth is contrasted by negative manufacturing growth, and better than expected initial jobless claims are countered with worse than expected continuing jobless claims, with fear still being the prevailing sentiment in the US markets.
Attention now turns to next week, as the first days of the year will be very important for the US market; the NFP data release will be indicative of how the economy has evolved over December and should provide guidance on whether the negative market sentiment is here to stay.
Click here to access the HotForex Economic Calendar
Dr Nektarios Michail
Market Analyst
HotForex
Disclaimer: This material is provided as a general marketing communication for information purposes only and does not constitute an independent investment research. Nothing in this communication contains, or should be considered as containing, an investment advice or an investment recommendation or a solicitation for the purpose of buying or selling of any financial instrument. All information provided is gathered from reputable sources and any information containing an indication of past performance is not a guarantee or reliable indicator of future performance. Users acknowledge that any investment in FX and CFDs products is characterized by a certain degree of uncertainty and that any investment of this nature involves a high level of risk for which the users are solely responsible and liable. We assume no liability for any loss arising from any investment made based on the information provided in this communication. This communication must not be reproduced or further distributed without our prior written permission.


